Theory of Stellar Atmospheric Shock Waves
Research
Micro-turbulence in stellar atmospheres is strongly related to the physics of atmospheric shock waves. Hydrodynamic turbulence in a stellar atmosphere turns rapidly into a field of shock waves, and running shock waves are known to be able to initiate a stellar wind and to heat stellar atmospheric layers. Shock trains propagating outwards are a natural consequence of acoustic energy generation in (massive) cool stars with a sub-photospheric convection zone. Micro-turbulence has often been called a 'fudge factor' in studies of stellar spectra. Such a qualification however does not advance physical understanding. The observed 'micro-turbulence velocity' broadening of spectral lines is not caused by stochastic small-scale turbulent motions (the classical notion of microturbulence), but rather by thermal movements in stochastically distributed high-temperature layers that trail shock fronts in very extended stellar atmospheres.
Through numerical integrations of the hydrodynamics equations we compute an observable microturbulence velocity, assuming that the dependence of shock wave energy on the wavenumber is of the Kolmogoroff-type (a power law spectrum), characterized by only one parameter: the maximum Mach number in front of the shocks. Behind every shock front a thin hot region originates (i.e. see the left-hand panel of Fig. 1). Spectroscopically, the thermal motions in these sheet-like regions cannot be distinguished from the stochastic hydrodynamic (shock wave) motion component, and therefore these hot regions add to the line broadening and will also contribute to the observed 'microturbulence' broadening of spectral lines.
We also observe strong near-IR CO emission in Rho Cas during variability phases of mean atmospheric expansion. The variable CO emission signals a dynamic mechanism that causes temporal sharp structures in the temperature- and density-structure of its very extended upper atmosphere. The CO emission can be produced by a pulsation-driven circumstellar shock wave in the cooling layers behind the shock front where the shocked gas expands while flowing into the following shock wave. After shock passage the cool CO layers are heated by compression in the trailing shock which partially dissociates the molecular CO gas fraction, quenches its local emission, and produces the variable CO emission.
Results
The application of the theory to yellow hypergiant Rho Cas reveals that a field of atmospheric shock waves which is critically supersonic, or have a mean Mach number only slightly exceeding unity, reproduces the observed supersonic microturbulence velocity of 11 km/s. Remarkably, the hydrodynamic velocity field in the shocks remains very small, of the order of only 0.5 km/s. Nevertheless, the momentum provided by such weak shock wave trains, assuming spherical geometric symmetry, is sufficient to initiate the large mass-loss rates (typically a few times 10^-5 M_sun/y) observed in cool hypergiants. These rates partly result from the very large stellar surface area (the mean photospheric radius of Rho Cas ranges between 400 and 500 R_sun), and the sonic point which is situated well inside the photosphere. The field of stochastic shock waves provides on average outward directed momentum which diminishes the effective atmospheric acceleration and increases the atmospheric scale height.
We observe a strong correlation of the near-IR CO emission flux with the radial velocity curve (from photospheric pulsations), which reveals that the CO emission lines form in the vicinity of the photosphere. We model the CO emission band spectra by inserting a cool gas layer of Tgas ~= 2500 K in the kinetic gas temperature structure of a plane-parallel hydrostatic model of the photosphere of Rho Cas with Teff = 7250 K and log(g) = 0.5. We fit the observed emission flux around the CO bandhead (that is least influenced by absorption), with radiative transfer calculations to constrain the optical depth of the cool CO layer (see right-hand panel of Fig. 1). We determine an atmospheric column mass along the line of sight that translates to a geometric distance for the cool CO layer of only ~5 % of R* above the photosphere.
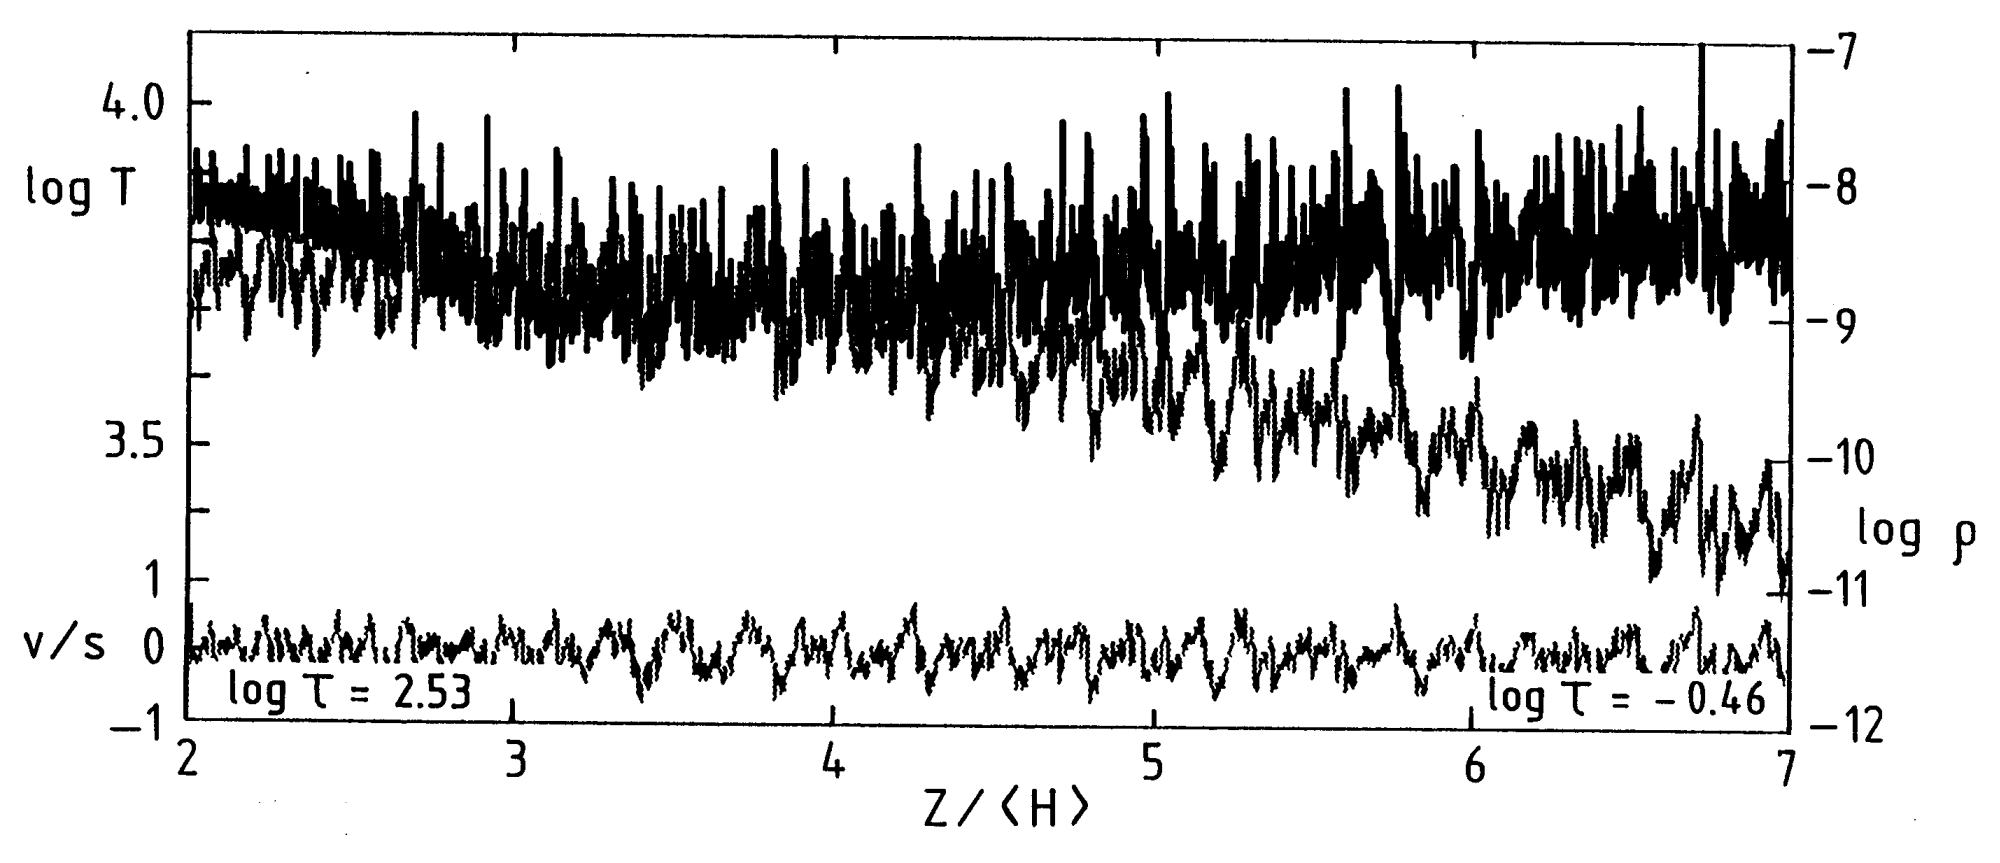
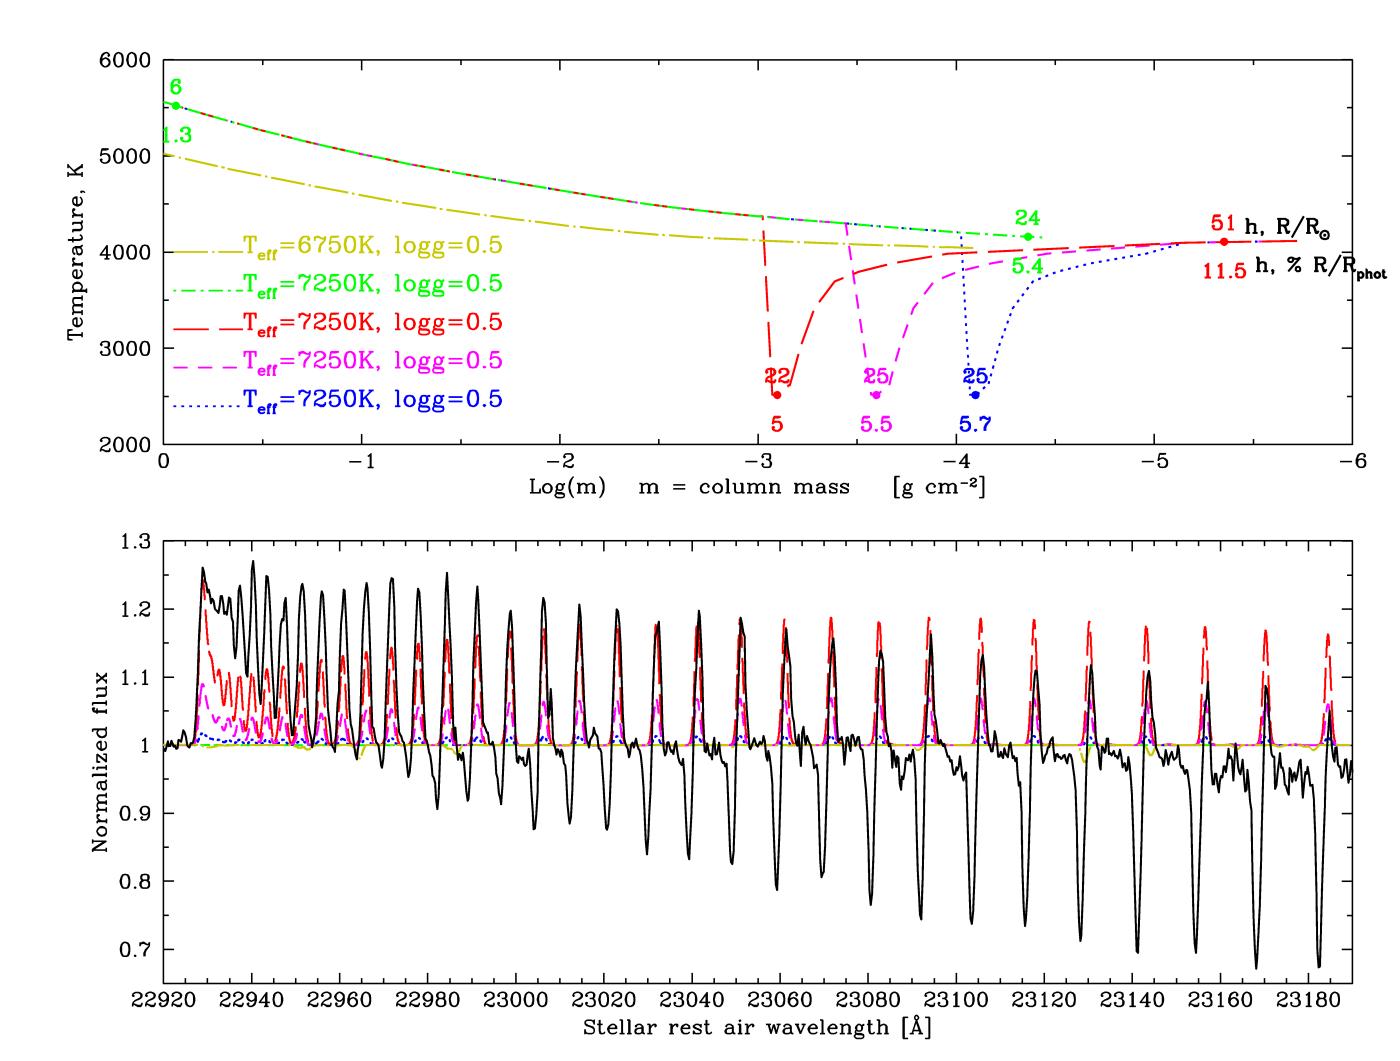
Figure 1: Left-hand panel: Variation of logT (upper), log(rho) (middle), and v/s
(bottom) in a shocked atmosphere with geometric depth z/< H >, where < H > is an average scale height. The model is not
for Rho Cas, but for a giant model with excessive shocks, viz.
Teff=7319 K and g_eff=10^3 cm / s^2, and for M_1 = 1.5.
These gravity- and maximum Mach number -values are both far
too large for Rho Cas, but are introduced here
to clearly show the features. The figure shows the run of the
three variables through a 'window' bordered by
z / < H > = 2 and 7.
Right-hand panel: Upper panel: atmospheric gas
temperature structures used to calculate model spectra of near-IR CO emission in Rho Cas
in the lower panel. The horizontal axis is in the column mass scale m. The outer layers of the atmosphere
correspond to smaller values of log(m). The marked numbers on the atmospheric
temperature profiles show the corresponding geometric scale expressed as the height
above the photosphere (where by definition the optical depth tau = 2/3 and Tgas = Teff)
in R_sun (upper row), and in percent of the photospheric radius
(adopting R*= 450 R_sun for Rho Cas; lower row).
Lower panel: High-resolution spectrum of Rho Cas
(solid black line) plotted against synthetic model spectra
calculated with the temperature structures in the upper panel.
Dot-dashed spectra are calculated using smooth hydrostatic atmosphere models,
while the long-, short-dashed and dotted models invoke a cool gas layer in the upper atmosphere
inserted at log(m)= -3, -3.5, and -4, respectively. The model adapted with a temperature
minimum at log(m)=-3 best fits the observed emission flux around the CO bandhead.
Read more: Long-term Spectroscopic Monitoring of Yellow Hypergiant Rho Cassiopeiae
Selected Papers
- Gorlova, N., Lobel, A., Burgasser, A. J., Rieke, G., Ilyin, I., & Stauffer, J. R. 2006, The Astrophysical Journal, 651, 1130, On the CO Near-Infrared Band and the Line-splitting Phenomenon in the Yellow Hypergiant Rho Cassiopeiae. PDF ADS
- de Jager C., Lobel A., & Israelian G., 1997, Astronomy & Astrophysics, 325, 714, Turbulence, Mass Loss and H alpha Emission by Stochastic Shocks in the Hypergiant Rho Cassiopeiae. PDF ADS