Atmospheric Conditions of Variable Massive Cool Stars
Research
The study of luminous cool (yellow to red) and hot (blue to white) stars addresses a number of key astrophysical questions that pertain to the very existence of stellar objects in general: Why do we observe many more luminous hot stars than luminous cool stars in the Galaxy? Why do we not see cool stars more luminous than about a million Suns? What physical mechanisms determine the relationship between a star's luminosity and its mass, the most fundamental parameter? Are these mechanisms universal in the sense that they always operate regardless of other intrinsic stellar parameters such as radius, surface temperature, composition, age, and rotation, or external properties like binarity, group or association membership, or even the star's location in the Galaxy? To phrase the last question differently: why do we observe stars with, for instance, comparable surface temperatures and total intrinsic magnitudes, but possessing very different spectral signatures?
The yellow hypergiants are massive cool stars in the very last stages of fast stellar evolution. Only a handful of these extreme stars have spectroscopically been identified in the Galaxy. Rho Cassiopeiae is notorious for being one of the brightest (V~4.5 mag.) members of this unique class of dynamically active supergiants that exist close to the Eddington luminosity limit. Spectral studies of Rho Cas, and of other yellow hypergiants, address key astrophysical questions about the origin of the scarcity of cool luminous stars compared to hot luminous stars.
The research program investigates the physics of atmospheric mechanisms that limit the observed luminosity of cool hypergiants to about one million times the solar value. Rho Cas is a distant yellow hypergiant for which modern, space-borne imaging does not reveal clearly discernible structures in its surrounding environment -for example, there appears to be no reflection nebula- and this is real hindrance to our efforts at inferring its stellar properties. But Rho Cas does have one formidable advantage over all other luminous stars: its extraordinary optical brightness. In particular, the unique spectral properties of Rho Cas reveal exceptionally large mass-loss rates, with outburst events separated by half centuries when it sheds a gas shell, and the surface temperature decreases by ~3000 K.
Our monitoring program of Rho Cas over the past 14 years combines high-resolution optical and near-IR spectroscopy from six telescopes in the USA and Europe. In the summer of 2000 the star brightened to 4th visual magnitude, then abruptly dimmed to 5.3 mag., while displaying tremendous spectral changes during a new outburst event, first observed in 1946. During the variability phases before maximum brightness, photospheric absorption lines showed a strong overall collapse of the extended atmosphere. Over the following 100 days the atmosphere rapidly expanded, reaching a maximum velocity of 35 km/s in a massive eruption, while the optical spectrum changed from F- to M-type.
We measured the wavelength shifts of newly formed titanium-oxide bands, revealing the largest mass-loss rate of about three percent of the solar mass in 200 d, directly observed during a single stellar outburst. The equivalent of 10,000 Earth masses of gas were blasted off into space. An avalanche of hydrogen recombination can effectively accelerate the fast expansion while the entire atmosphere temporarily cools down.
Continuous monitoring of the Balmer H alpha line over the past five years shows a very strong inverse P Cygni profile also observed before the millennium outburst (and before a more moderate outburst event of 1986), but which remarkably rapidly transformed into a P Cygni profile after a new visual brightness maximum in March 2003 (Fig. 1). It signals that the upper atmosphere reversed from contraction into fast global expansion with enhanced mass-loss. Rho Cas's increased dynamic activity in the aftermath of the outburst prompts for sustained spectral monitoring. In case a new outburst occurs, the observations will help us to pinpoint the physical mechanisms that instigate and drive these gargantuan stellar explosions.
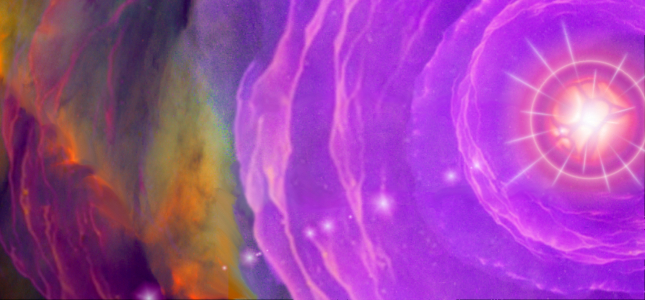
Observations of Betelgeuse with the Hubble Space Telescope show that warm gas from the supergiant's upper chromosphere is inside its cold and dusty outer gas envelope. In this artist's impression of the upper chromosphere, shock waves from the star's pulsating surface traverse the chromosphere (shown in violet
and blue colors) and enter into the cooler dust envelope (in orange and black). The waves produce the warm gas which mixes with the cold gas.
On the other hand M-class supergiant Betelgeuse, which if placed at the Sun's position would have a surface somewhere between Mars's and Jupiter's orbits, sheds each year about a millionth of a solar mass; the mass loss comes from steady wind leaving the star's huge surface. Red supergiants are, therefore, one of the most important cosmic factories for replenishing the interstellar medium with material processed through nuclear fusion reactions. More specifically in the case of yellow hypergiants such as Rho Cas, the copious loss of mass from a cool luminous star is believed to have a decisive influence on the star's blueward evolution, which may last only as long as 50,000 years, less than one percent of the star's entire lifetime. Rho Cas is smaller than red supergiant Betelgeuse with a mean radius around 700 times the Sun's radius. But Betelgeuse is not a hypergiant. The term -hypergiant- does not refer to the large size or luminosity of a massive star, but instead to its exceptional spectral properties indicative of a distended and very dynamically active atmosphere. One out of a million stars in our Galaxy is a normal supergiant star, yet fewer are hypergiants. And the cool hypergiants are extremely scarce, their erratic atmospheric behavior thought to result from their advanced evolutionary stage on a blueward evolutionary loop.
Ongoing research of Betelgeuse's extended chromosphere and dust envelope has recently provided important advances in understanding the dynamics and thermal structure of the atmospheres and winds of evolved stars. Detailed investigations of cool star atmospheres are much more intricate compared to hot stars because of enhanced atomic and molecular opacities and complicated dynamic activity (pulsation and convection), although late-type stars are one of the most important laboratories for stellar atmospheric physics. High-resolution spectroscopy of luminous cool stars provides fundamental information about the complex physical mechanisms that cause their exceptionally large mass-loss rates (M_dot >= 10^-6 M_sun/y) by which these massive stars continuously replenish the interstellar medium with material that has been processed through nuclear fusion reactions, and from which many structures in circumstellar and interstellar environments originate. Unlike the supersonic accelerating winds of hot supergiants, the mass-loss mechanisms that drive the slower winds of cool supergiants like Betelgeuse are presently not well understood due to a persistent lack of high-quality ultraviolet spectra that probe the important physical properties of atmospheric regions located between the photosphere and the extended circumstellar dust envelope.
Spatially resolved raster scans observed with HST-STIS using a small aperture across Betelgeuse's UV disk in HST Cycles 7 & 8 reveal subsonic oscillations of the inner chromosphere from radiative transfer fits to the detailed asymmetric profiles of the Si I 2516 resonance emission line. The near-UV spectra show long-term changes of gas movements in the lower chromosphere with pulsations of the deeper -presently unresolved- stellar photosphere. For the first time, these two-dimensional STIS spectra provided direct evidence that Betelgeuse's inner chromosphere oscillates non-radially, thereby occasionally exhibiting simultaneous up- and down-flows. More information is available in this paper Lobel, Alex, 2002, Chromospheric dynamics of Betelgeuse from STIS Spectra from NASA/ADS Bibcode: 2002csss...12E...1L, also available here.
Chromospheric dynamics of Betelgeuse from STIS spectra. The photo-montage made in ultraviolet light shows the pulsating atmosphere of Betelgeuse. The star is scanned with the Space Telescope Imaging Spectrograph. Seven spectra are recorded through a small field of view shown by the rectangle at different positions on the disk, marked by the crosses. The thick yellow curves show the shape of a double-peaked emission line which emerges from Betelgeuse's chromosphere. The depression between the peaks is formed far out in this warmer envelope. The spectra in the top images of January and March '98 reveal that this outer region collapses since the left-hand peak of the emission line is everywhere stronger than the right. But the STIS scan in the lower left image of September '98 unveils how atmospheric gas begins to move up in the fifth scan position, where the right-hand peak exceeds the left. Here gas streams in opposite directions at the same time through the star's outer atmosphere. The spectral scan in the lower right image of March '99 shows that the expandingtrend proceeds and extends further across the chromosphere. The arrows in the images point North in the plane of the sky and should be aligned when comparing the location of surface details. Note that the mean intensity levels of the four images have been equalized to bring out these details. The top images are actually observed brighter than the lower ones. Note also that some spectral scans are taken a week apart from the images.
Results
During three years after the 2000-2001 outburst of Rho Cas we observe an unusually strong inverse P Cygni profile in Balmer H alpha, indicating a new collapse of the hypergiant's extended upper atmosphere. The H alpha line transformed from a prominent inverse P Cygni profile into a P Cygni profile after mid 2003 (Fig. 1). The P Cygni line shape of H alpha is very remarkable because it was not clearly observed during the 2000 brightness minimum. It indicates a new strong expansion of the upper atmosphere after mid 2003 for which we measure expansion velocities up to 120 km/s. High-resolution spectroscopic observations of April 2004 show that the peculiar P Cygni H alpha line shape further developed, resulting in a new variability phase with enhanced mass-loss. The spectral evolution is expected since we observe that the radial velocity curve of the absorption portion of H alpha is at least twice longer than the (quasi-) period of photospheric absorption lines with P~300-500 d.
The Far Ultraviolet Satellite Explorer spectrum of Rho Cas does not reveal the high temperature emission lines of O VI 1032 & 1037 (right-hand panel of Fig. 1), or the C III 977 line. Our far-UV observations also demonstrate that there is no evidence of a faint hot (e.g. white dwarf) companion star in Rho Cas, also ruled out by our long-term radial velocity and light curve monitoring. However, we clearly observe these warm transition region plasma emission lines in the classical Cepheid variable Beta Dor (F-G Iab-Ia). Its smaller radius of R*=64 R_sun, compared to Rho Cas (R*=400-500 R_sun with log(g)=0.5-1.0), signals that the larger average atmospheric gravity acceleration is an important stellar parameter to sustain high-temperature plasmas in the outer atmosphere of less luminous (pulsating) supergiants. This is supported by the observation that transition region plamsa emission lines are also absent in red supergiant Betelgeuse with R*=700 R_sun and log(g)=-0.5.
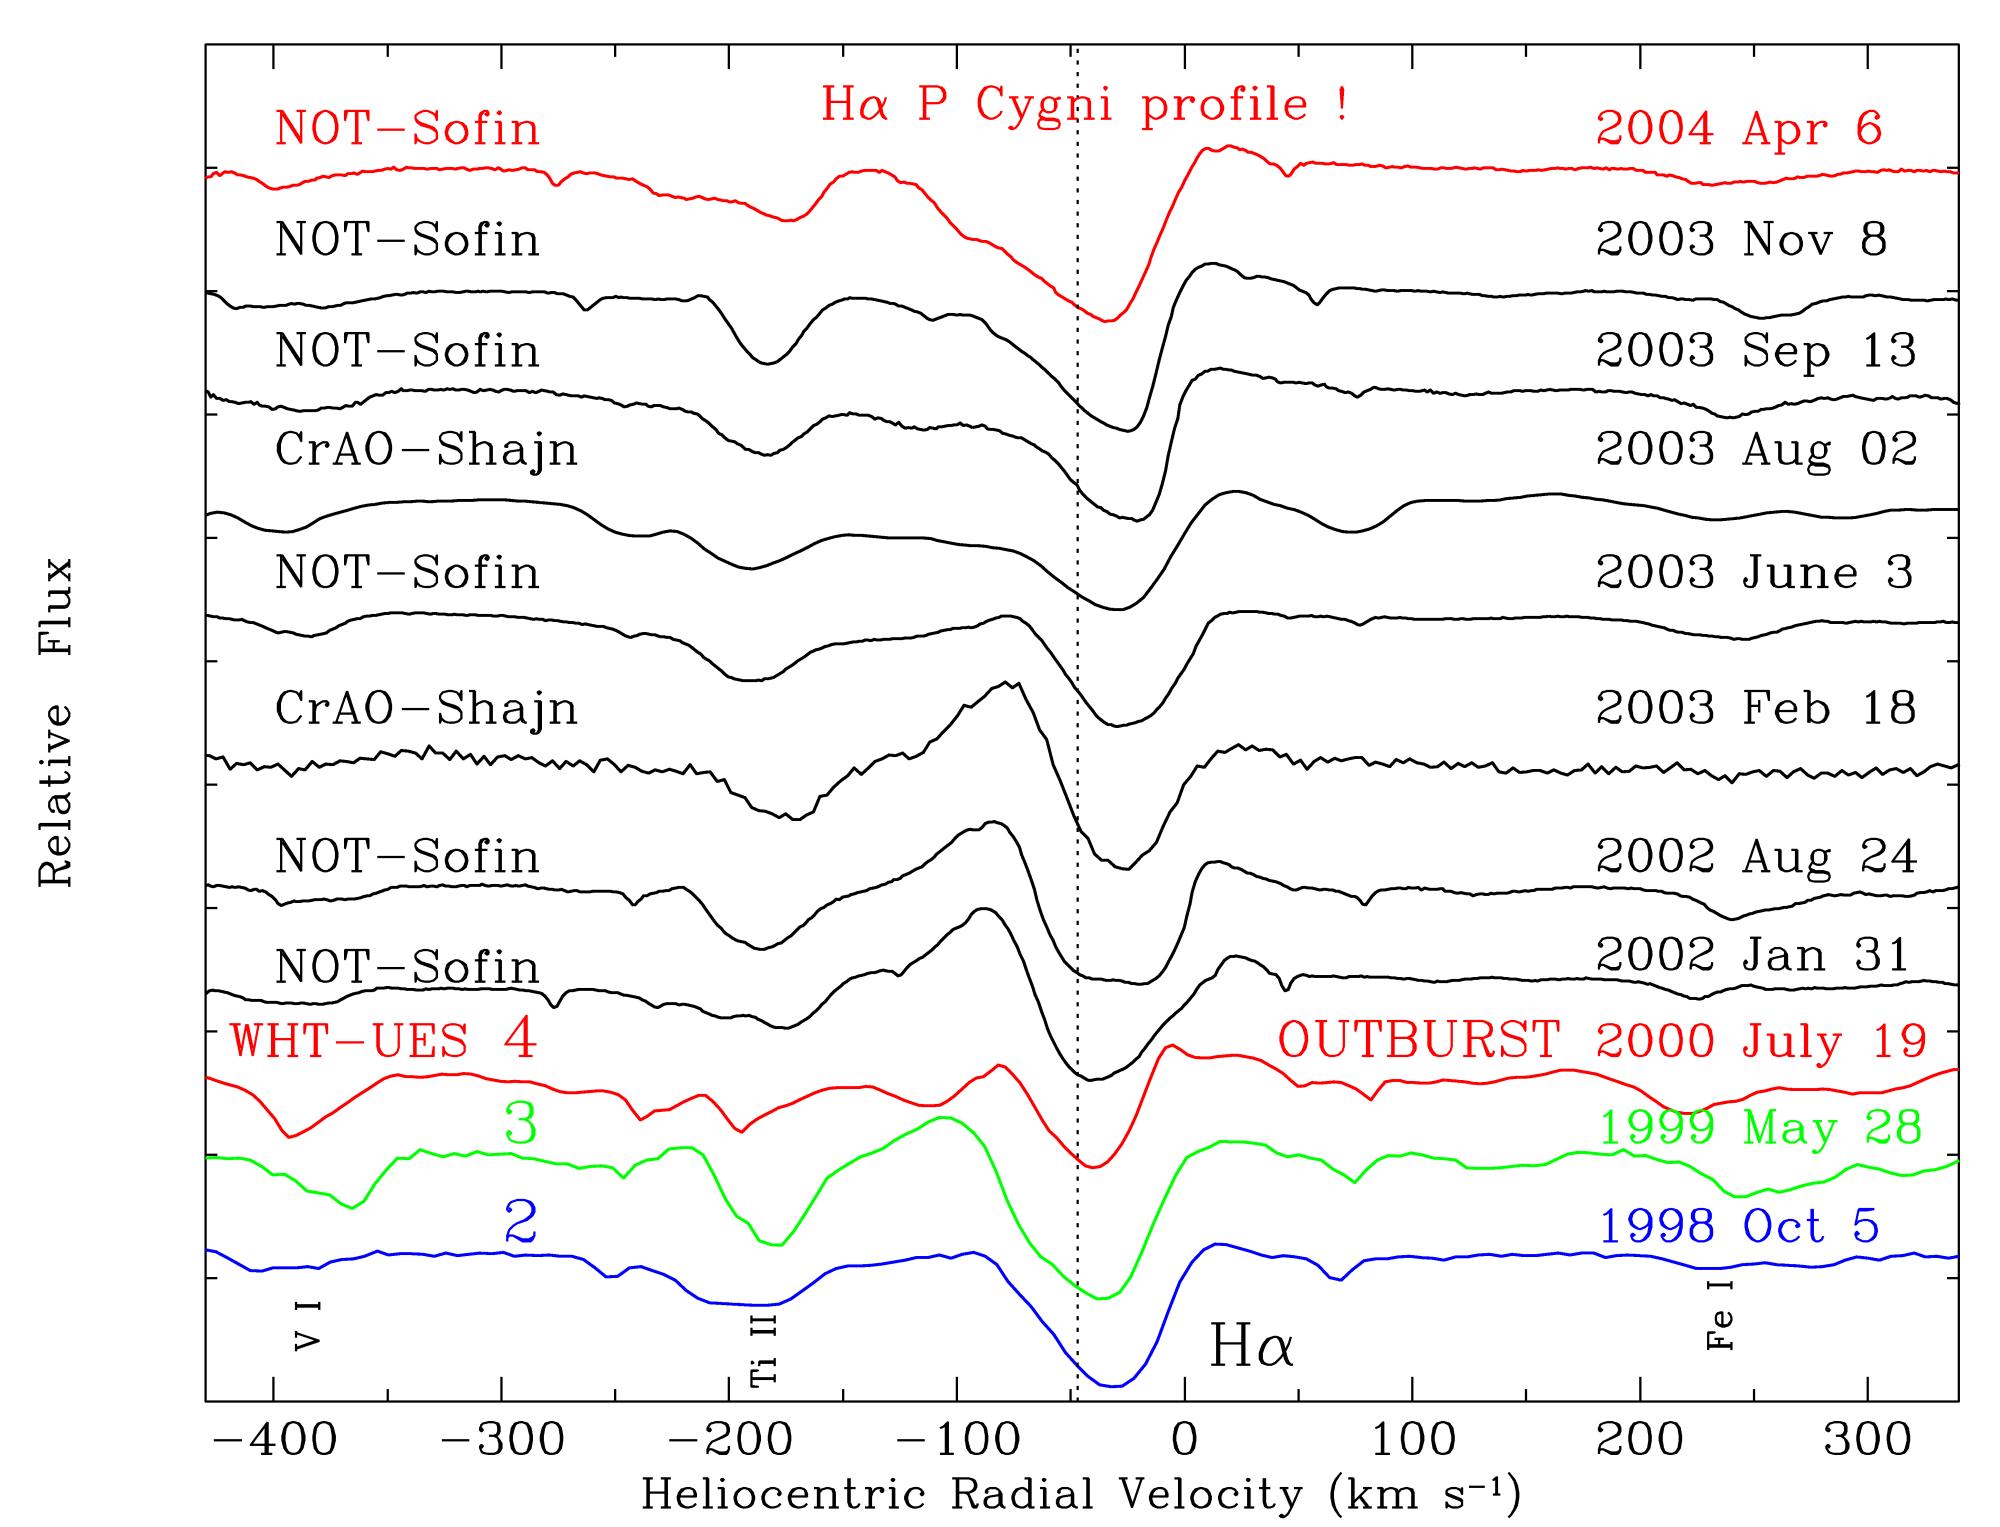
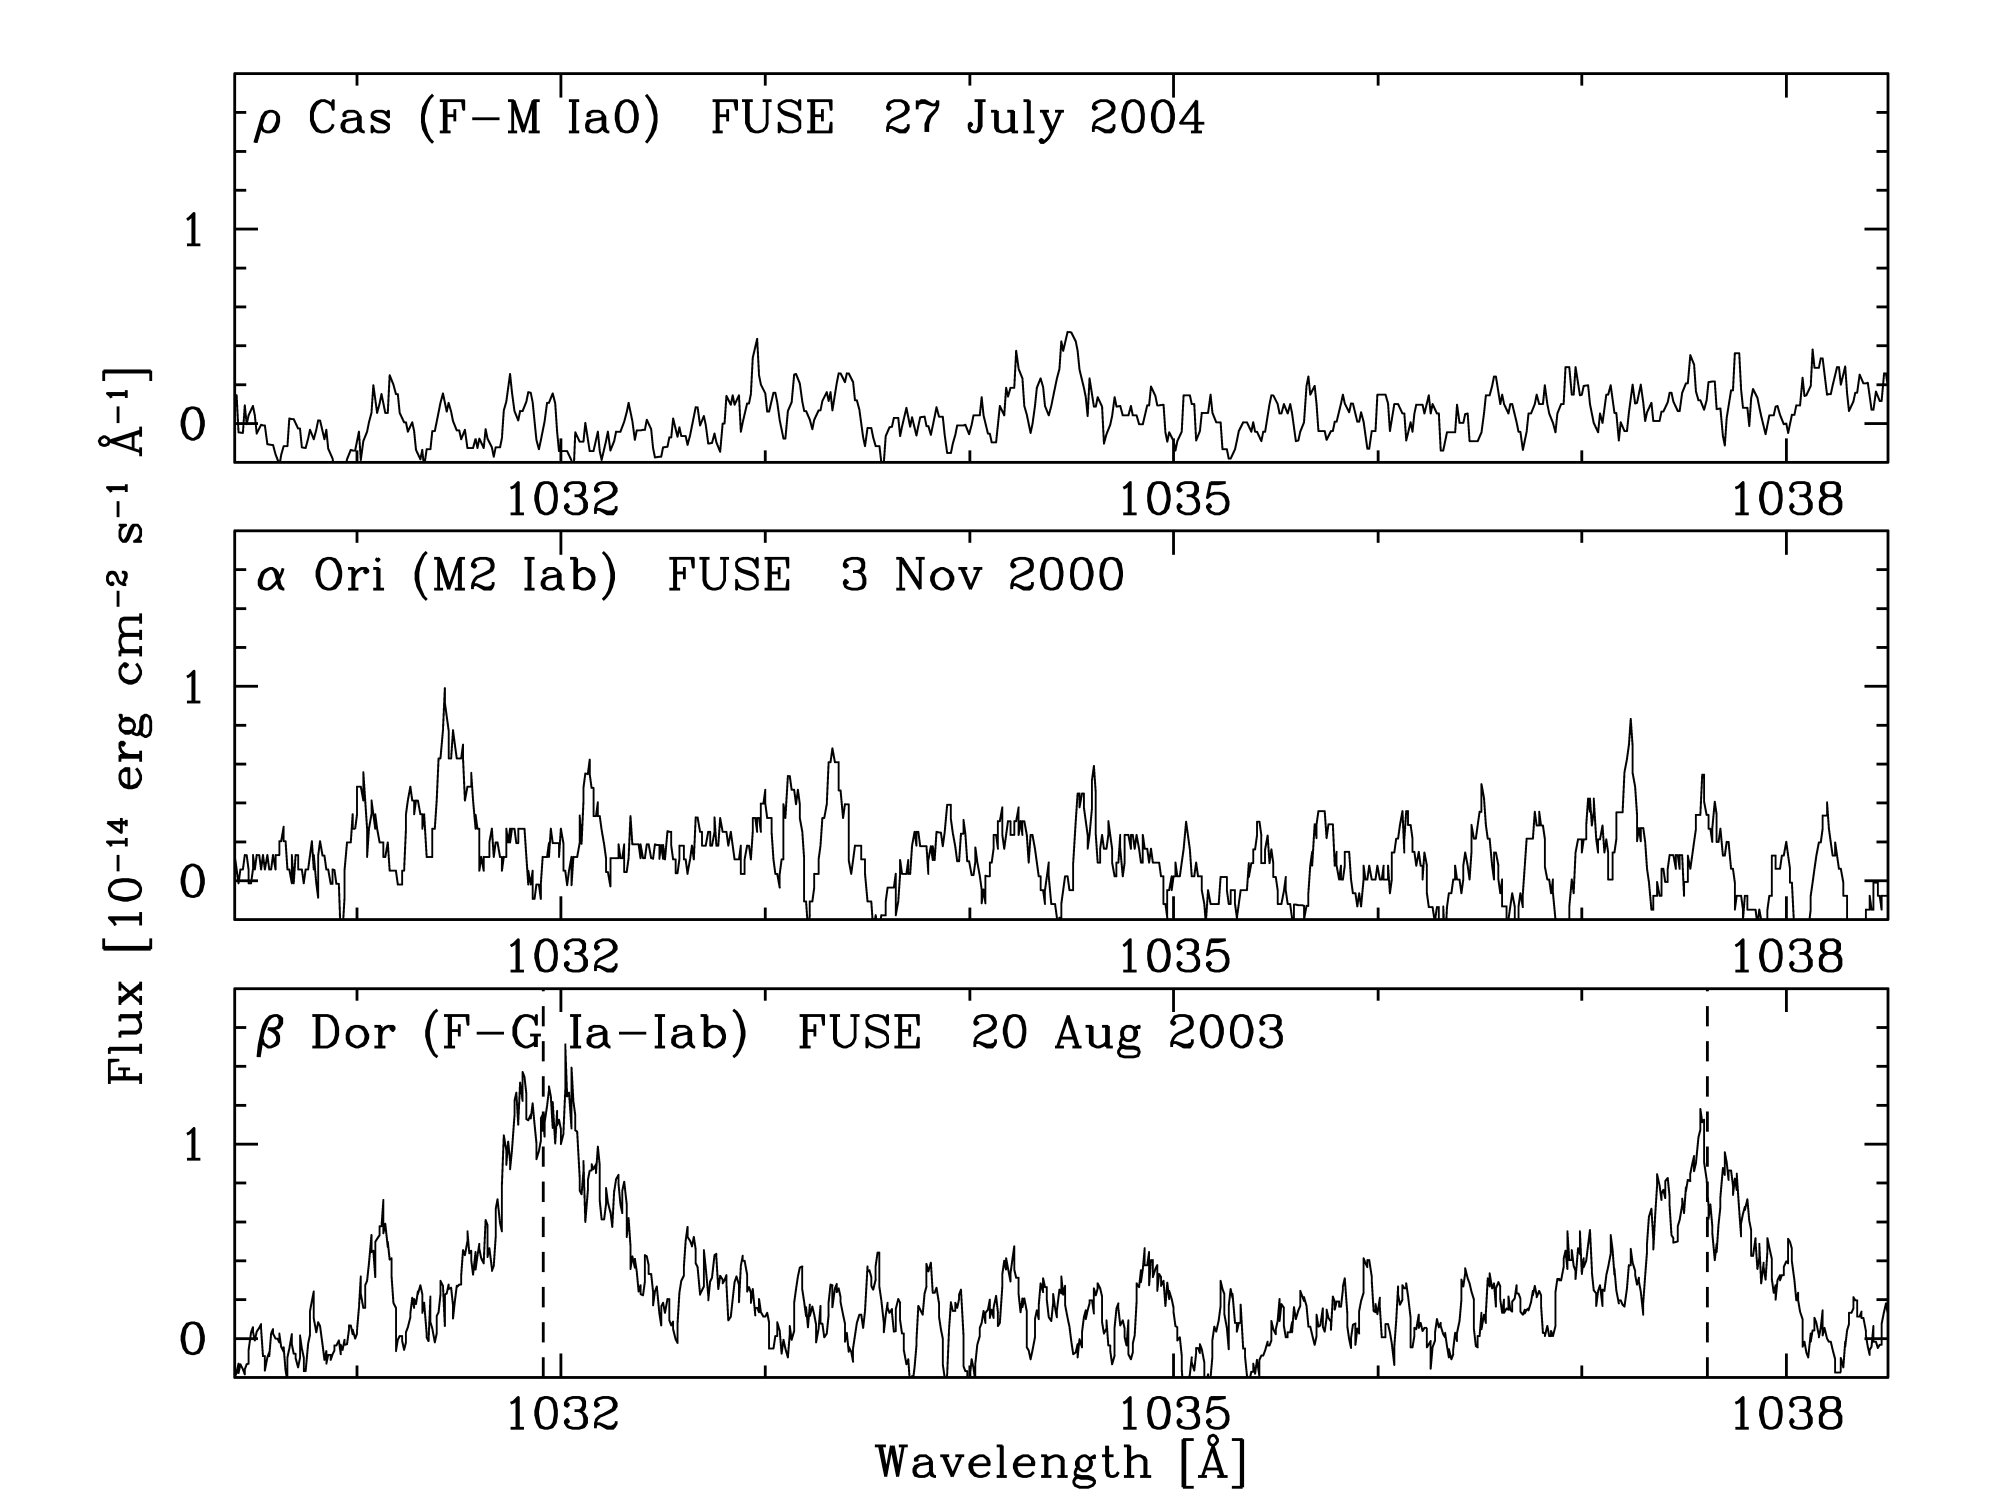
Figure 1: Left-hand panel: The spectrum of Rho Cas around the Balmer H alpha line of hydrogen. This spectral line forms over a large fraction of the upper atmosphere and continuously changes its shape. In the year before the outburst of mid-2000, the line revealed strong emission to the left of the H alpha absorption trough; emission at this side of the line is usually not observed in Rho Cas. The absorption trough is shifted to the right with respect to the center-of-mass velocity of the hypergiant (the dotted vertical line), which signals a strong collapse of the upper atmosphere. Since mid-2001, very strong emission reappeared to the left of the H alpha line, but transformed into a P Cygni profile after mid 2003. The line profile changes of H alpha in Rho Cas reveal that
following the outburst event of 2000 its upper atmosphere collapsed over a period of ~2.5 years (producing the strong inverse P Cygni
line profile), which reversed to very strong expansion after mid 2003. Right-hand panel: FUSE observations show that high-temperature emission lines of O VI 1032 & 1037 are neither observed in yellow hypergiant Rho Cas (upper panel), nor in red supergiant Betelgeuse (middle panel). The O VI lines are however clearly observed in the smaller supergiant Cepheid variable Beta Dor (lower panel) having larger effective gravity acceleration of the atmosphere.
The left-hand panel of Fig. 2 shows the Mg II k line profile at the respective slit positions up to 1000 mas, compared to an image of the near-UV continuum (in false colors) observed with HST-Faint Object Camera. The FWHM of the image is about twice the optical diameter of the supergiant of 56 mas. The central (self-) absorption core results from scattering opacity in the chromosphere. The asymmetry of the emission line component intensities probes the chromospheric flow dynamics in our line of sight. The profiles observed in the upper chromosphere reveal an increase of asymmetry with a weaker short-wavelength emission component. It signals substantial wind outflow opacity in the upper chromosphere, which fastly accelerates beyond 200 mas (~8.1 R*).
We compute that the warm chromospheric plasma assumes kinetic gas temperatures above 2600 K out to 1 arcsecond, for a range of realistic gas density values we determine from detailed radiative transport models of the inner circumstellar dust envelope. These chromospheric gas densities correspond to the range of model electron densities (Ne) required to compute the self-absorbed shape of the Si I 2516 resonance line in the upper right-hand panel of Fig. 2. The best fit (solid red line in upper panel) to the spatially resolved line profile observed at 75 mas (blue solid line) is obtained for a thermal model of the inner chromosphere (r <= 10 R*) (lower left panel) with Tgas below 5500 K (where Ne ~ 2.8 10^8 cm^-3), and Ne decreases outward. The dynamic model (lower panel right) requires line-of-sight microturbulence velocities with a local maximum of ~13 km/s, and an outward accelerating (gas) wind velocity increasing to 4.5 km/s, to match the asymmetric shape and width of the Si I emission line. The caption of Fig. 2 also offers an animation demonstrating important radiative transfer effects on the formation of the detailed Si I line profile by varying the electron density log(Ne) of the chromospheric model structure.
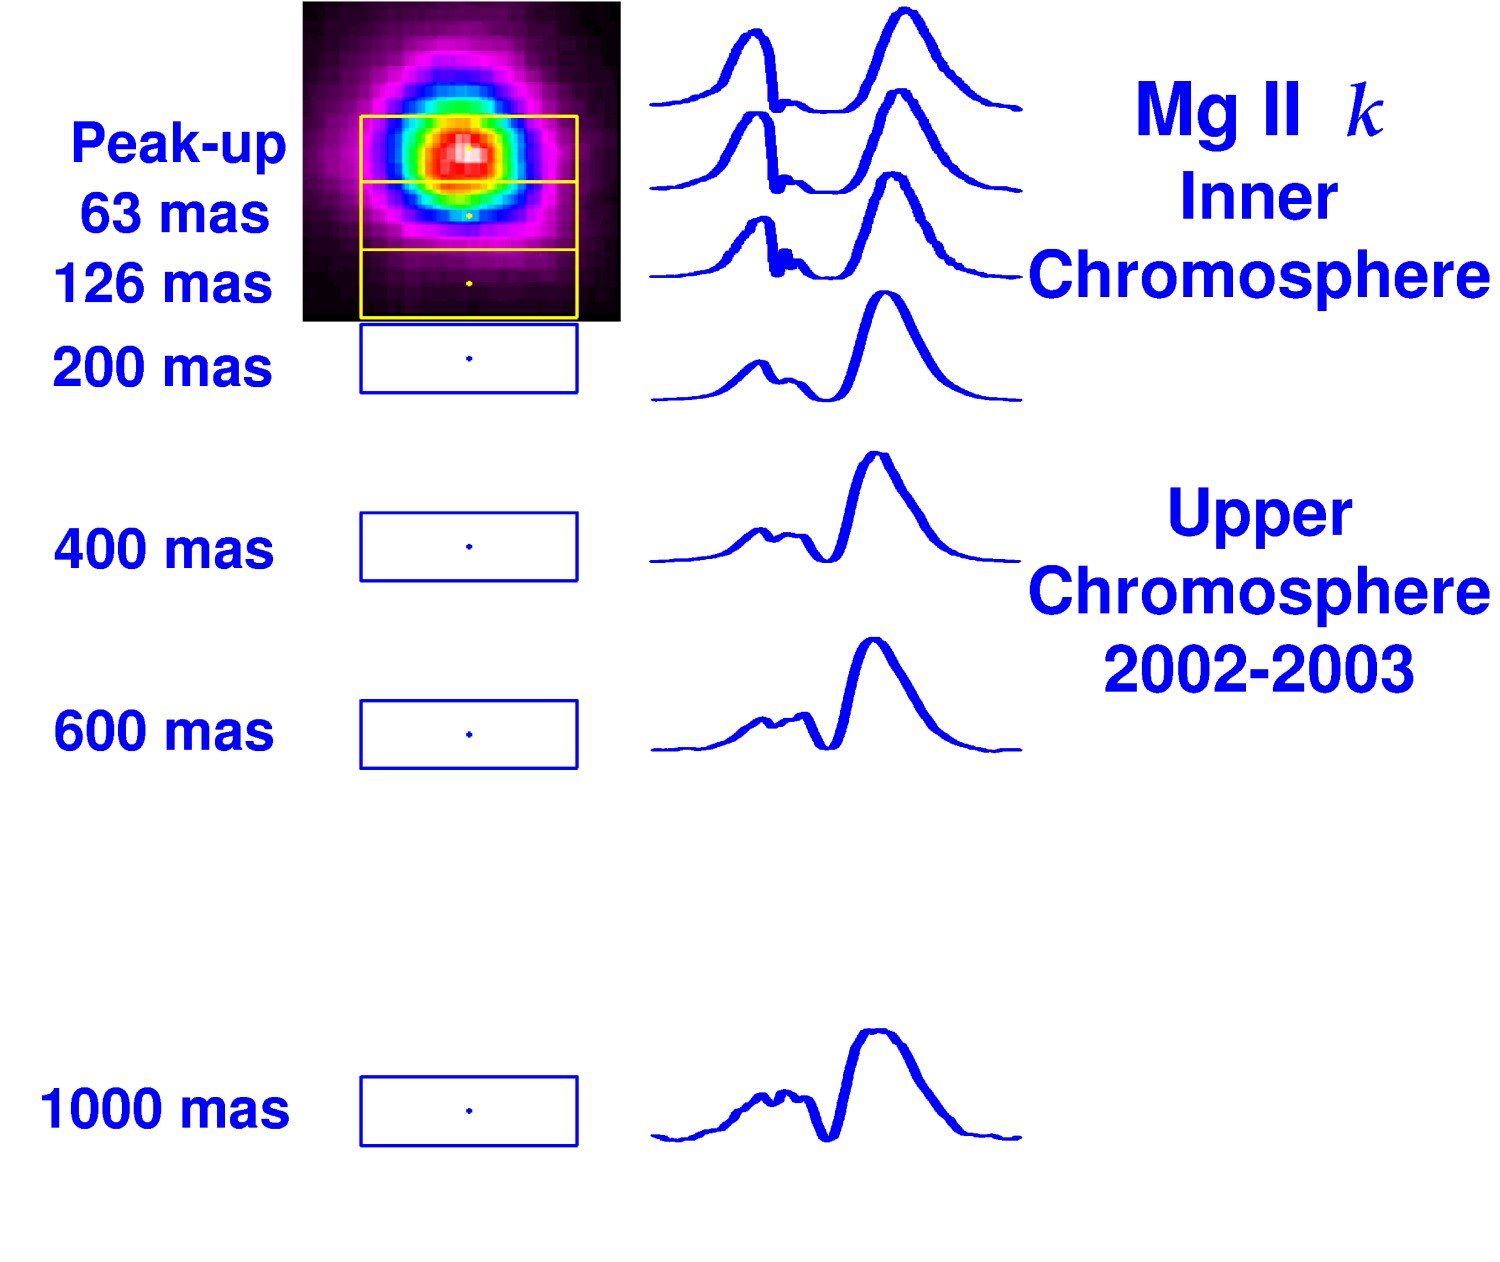
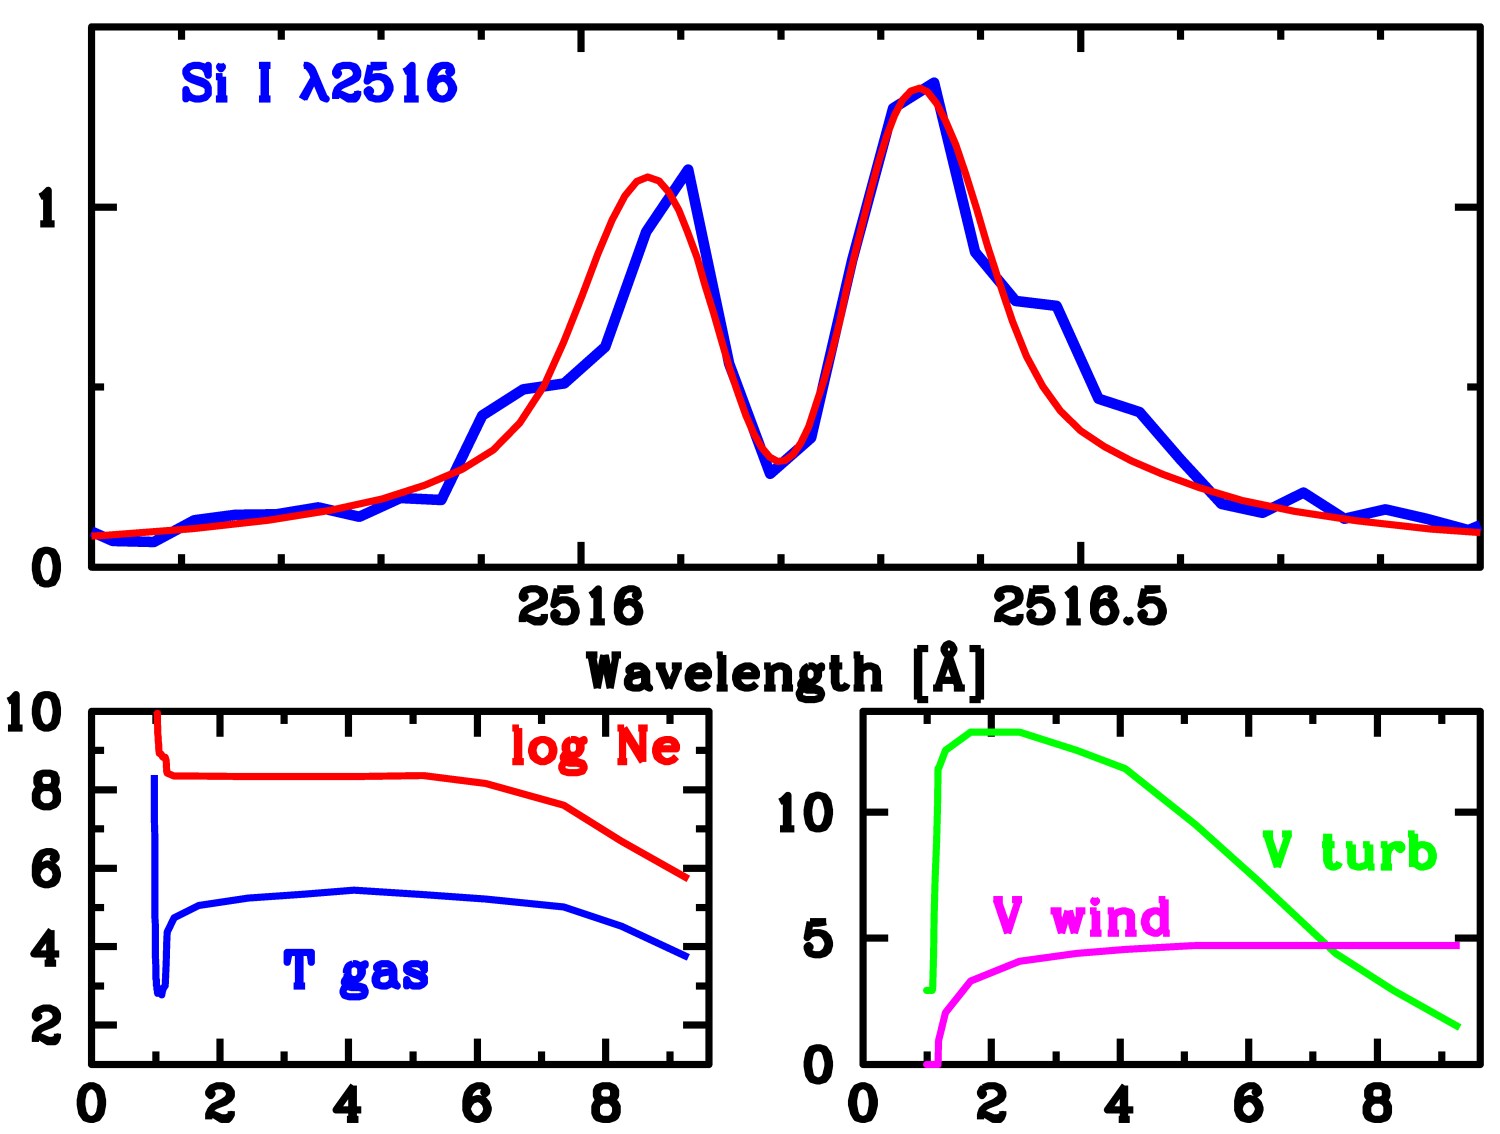
Figure 2: Left-hand panel: Spatially resolved Hubble Space Telescope STIS observations of the Mg II k resonance emission line across Betelgeuse's inner and upper chromosphere out to one arcsecond using the 63 by 200 mas aperture (blue rectangles) with respect to a (false color) near-UV image of the inner chromosphere. The Mg II line is scaled to the same intensity to show important profile shape changes.
Right-hand panel: Detailed non-LTE radiative transfer fits (red line in upper panel) to the spatially resolved Si I 2516 emission line observed at 75 mas (blue line). The corresponding electron density structure of the inner chromosphere model (lower left-hand panel) is varied to illustrate the goodness of fit; view animation. T_gas is shown in kK units, and Vwind and Vturb in km/s units.
We compute that the local kinetic gas temperatures of the warm chromospheric gas component in the outer atmosphere exceed 2600 K, when assuming local gas densities of the cool gas component we determine from radiative transfer models that fit the 9.8 micrometer silicate dust emission and its radial surface brightness. The spatially resolved STIS spectra directly demonstrate that warm chromospheric plasma co-exists with cool gas in Betelgeuse's circumstellar dust envelope. These STIS data can therefore support the dust-gas interaction driving mechanism, yielding the high mass-loss rates observed in cool supergiants and AGB stars. From a thermodynamic point of view however, the uniform dusty wind model fails to account for the large local kinetic gas temperature differences because the warm chromospheric gas (Tgas >= 2600 K) is observed far inside the circumstellar dust envelope (where Tdust <= 600 K), out to 3 arcseconds, ~120 R* away from Betelgeuse.
Read more: Chromospheric Dynamics of Betelgeuse from STIS Spectra
Read more: AAS Press Release of Jan. 2004: Storms of Hot and Cold Gas Rage in Betelgeuse's Turbulent Atmosphere
Read more: Theory of Stellar Atmospheric Shock Waves
Read more: Dusty Environments of AGB and Cool Supergiant Stars
Read more: Long-term Spectroscopic Monitoring of Yellow Hypergiant Rho Cassiopeiae
Selected Papers
- Lobel, Alex, 2002, Chromospheric Dynamics of Betelgeuse from STIS Spectra, 12th Cambridge Workshop on Cool Stars, Stellar Systems, and the Sun, Univ. of Boulder, Colorado, USA. Oral Contribution: https://cs12.colorado.edu/proceedings/oral/thursday/lobelproc.html PDF NASA/ADS
- Lobel, A. 2005, Spatially Resolved STIS Spectroscopy of Betelgeuse's Upper Chromosphere and Circumstellar Dust Envelope, 13th Cambridge Workshop on Cool Stars, Stellar Systems, and the Sun, ESA SP-560, 327, eds. F. Favata et al., Jul 2004, Hamburg, Germany. PDF NASA/ADS
- Lobel, A., et al. 2003, The Astrophysical Journal, 583, 923, High-Resolution Spectroscopy of the Yellow Hypergiant Rho Cassiopeiae from 1993 Through the Outburst of 2000-2001. PDF NASA/ADS
- Lobel, A., Aufdenberg J., Ilyin, I., & Rosenbush, A. E. 2005, Mass-loss and Recent Spectral Changes in the Yellow Hypergiant Rho Cassiopeiae, 13th Cambridge Workshop on Cool Stars, Stellar Systems, and the Sun, ESA SP-560, 771, eds. F. Favata et al., Jul 2004, Hamburg, Germany. PDF NASA/ADS