Atomic Data for Spectral Standard Stars
Research
The online SpectroWeb database of spectral standard stars is permanently updated with new oscillator strength values of atomic absorption lines observed in the optical spectra of these reference stars. The new line oscillator strengths are measured with best fits to the disk-integrated optical spectrum of the Sun using state-of-the-art detailed spectral synthesis calculations. The new line oscillator strengths for neutral atomic lines are validated with detailed synthetic spectrum calculations for Procyon. The measured log(gf)-values in SpectroWeb are improved over the values currently offered in public databases that can be queried online. The newly measured atomic log(gf)-values are made available in the SpectroWeb database which interactively displays the observed and computed stellar spectra, together with corresponding atomic line data. The log(gf)-values of singly-ionized lines in SpectroWeb will be updated with best fits to the observed spectrum of Procyon and validated with detailed spectrum calculations for Canopus (F0).
Results
We measure the log(gf)-values of 1178 atomic lines observed in the solar spectrum between 4000 and 6800 Angstroms with best fits using the Scanspec code. The theoretical spectra are computed with radiative transfer in LTE using 1D hydrostatic models of the stellar atmosphere. The atmospheric parameters in the model grid Teff, log(g), and the projected microturbulence velocity are varied until an overall best fit to the observed spectrum is obtained. It involves an iterative fit procedure whereby the differences of relative line depths between the observed and computed high-resolution spectra are minimized. The fit procedure utilizes the `normal' stellar photospheric spectrum in wavelength regions that are void of blends with strong telluric lines. It also excludes the broad H I Balmer lines, and the strong doublet lines of Ca II H & K and Na I D. The detailed modeling of these broad line profiles requires semi-empiric radiative transfer calculations in non-LTE. The left-hand panel of Fig. 1 shows 1178 atomic lines with measured log(gf)-values in the solar spectrum (open symbols). The amount of selected weak, medium-strong, and strong atomic absorption lines is almost uniformally distributed with wavelength. The amount of measured Fe I lines (filled symbols) with central normalized depths below 40 % (we compute without instrumental broadening) is also uniformally distributed.
The spectral synthesis calculations reveal for the neutral iron-group elements, such as Fe I, Ni I, Cr I, and Ti I, a statistically significant over-estimation of the literature log(gf)-values for weak absorption lines with normalized central line depths below 15%. The right-hand panel of Fig. 1 shows that the log(gf)-values of weak Fe I lines observed in the Sun are almost systematically decreased (open symbols) to log(gf)-values in SpectroWeb below -2.0. The stronger lines (with central line depths exceeding 15%) require Delta log(gf)<0 (open triangles) and Delta log(gf)>0 (filled symbols) corrections for comparable amounts of Fe I lines that best fit the observed solar spectrum. For abundant lighter elements (e.g. Mg I and Ca I) this trend is statistically not significantly detectable. The log(gf) over-estimations are attributed to the limited accuracy of small log(gf)-values for weak lines presently offered in online atomic databases. The oscillator strengths of many weak, medium-strong, and strong lines require further updates for reliable future line identifications in spectral standard stars.
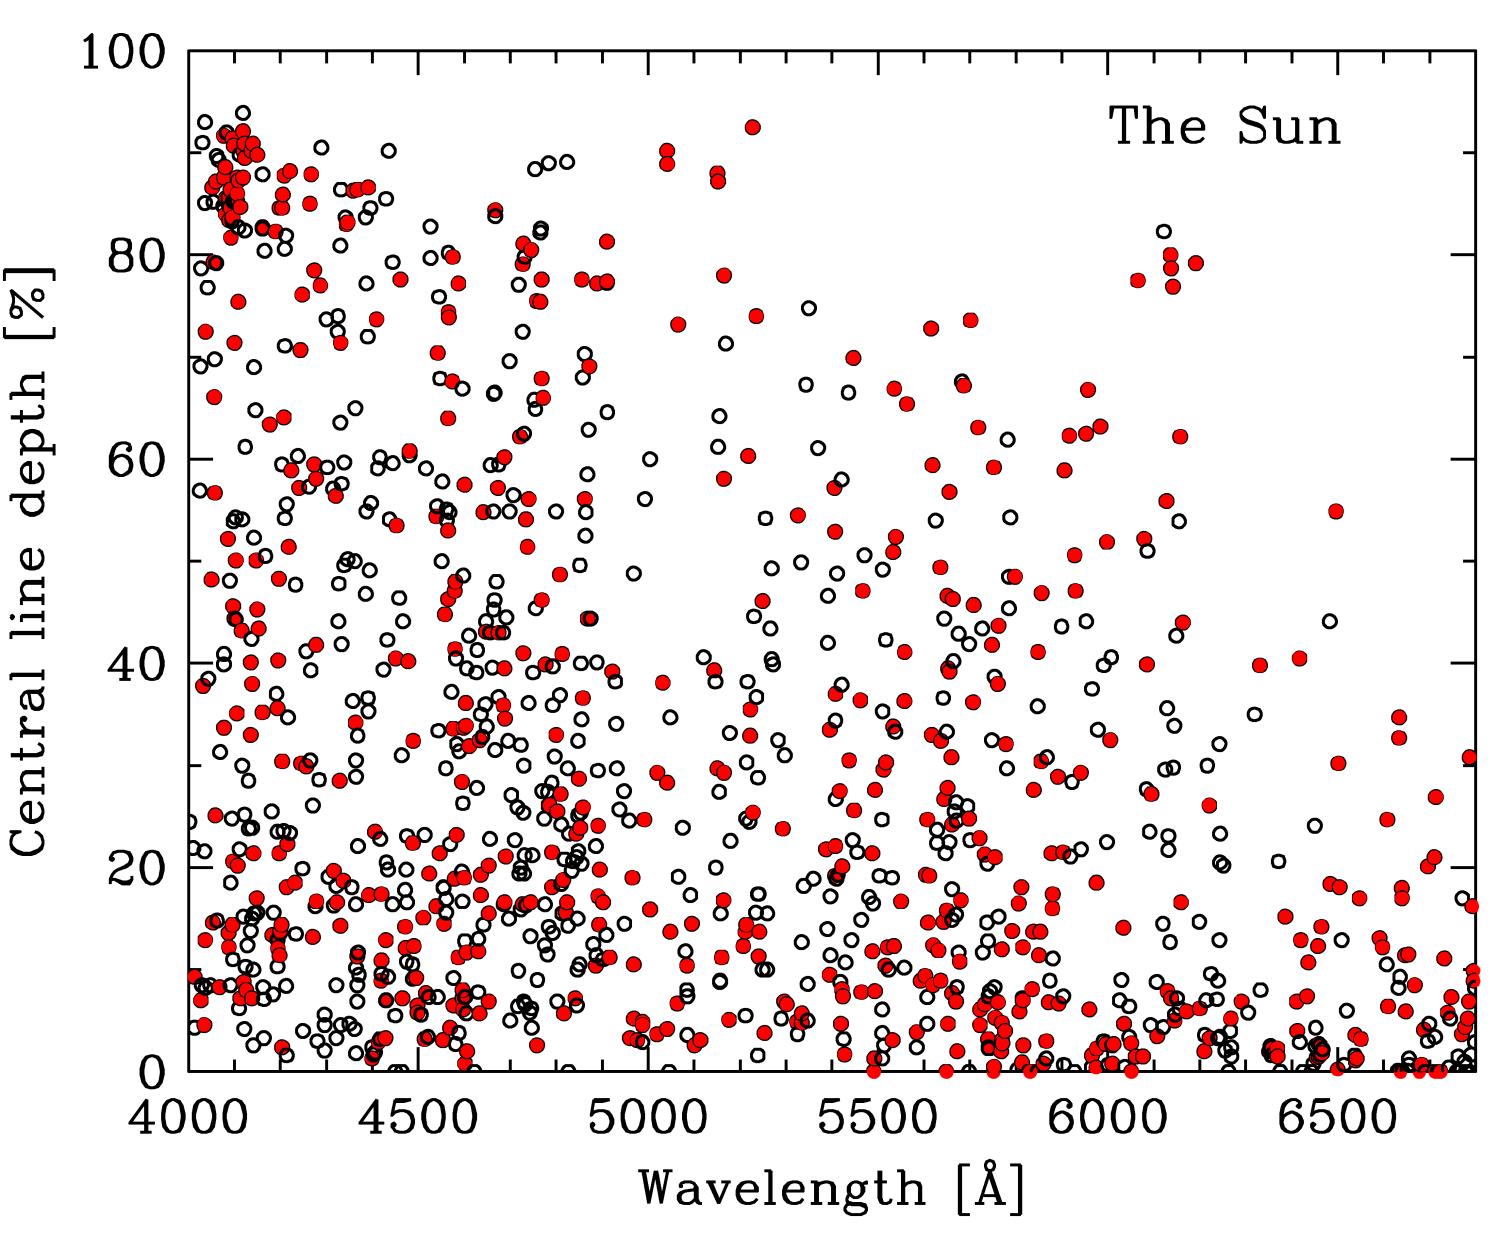
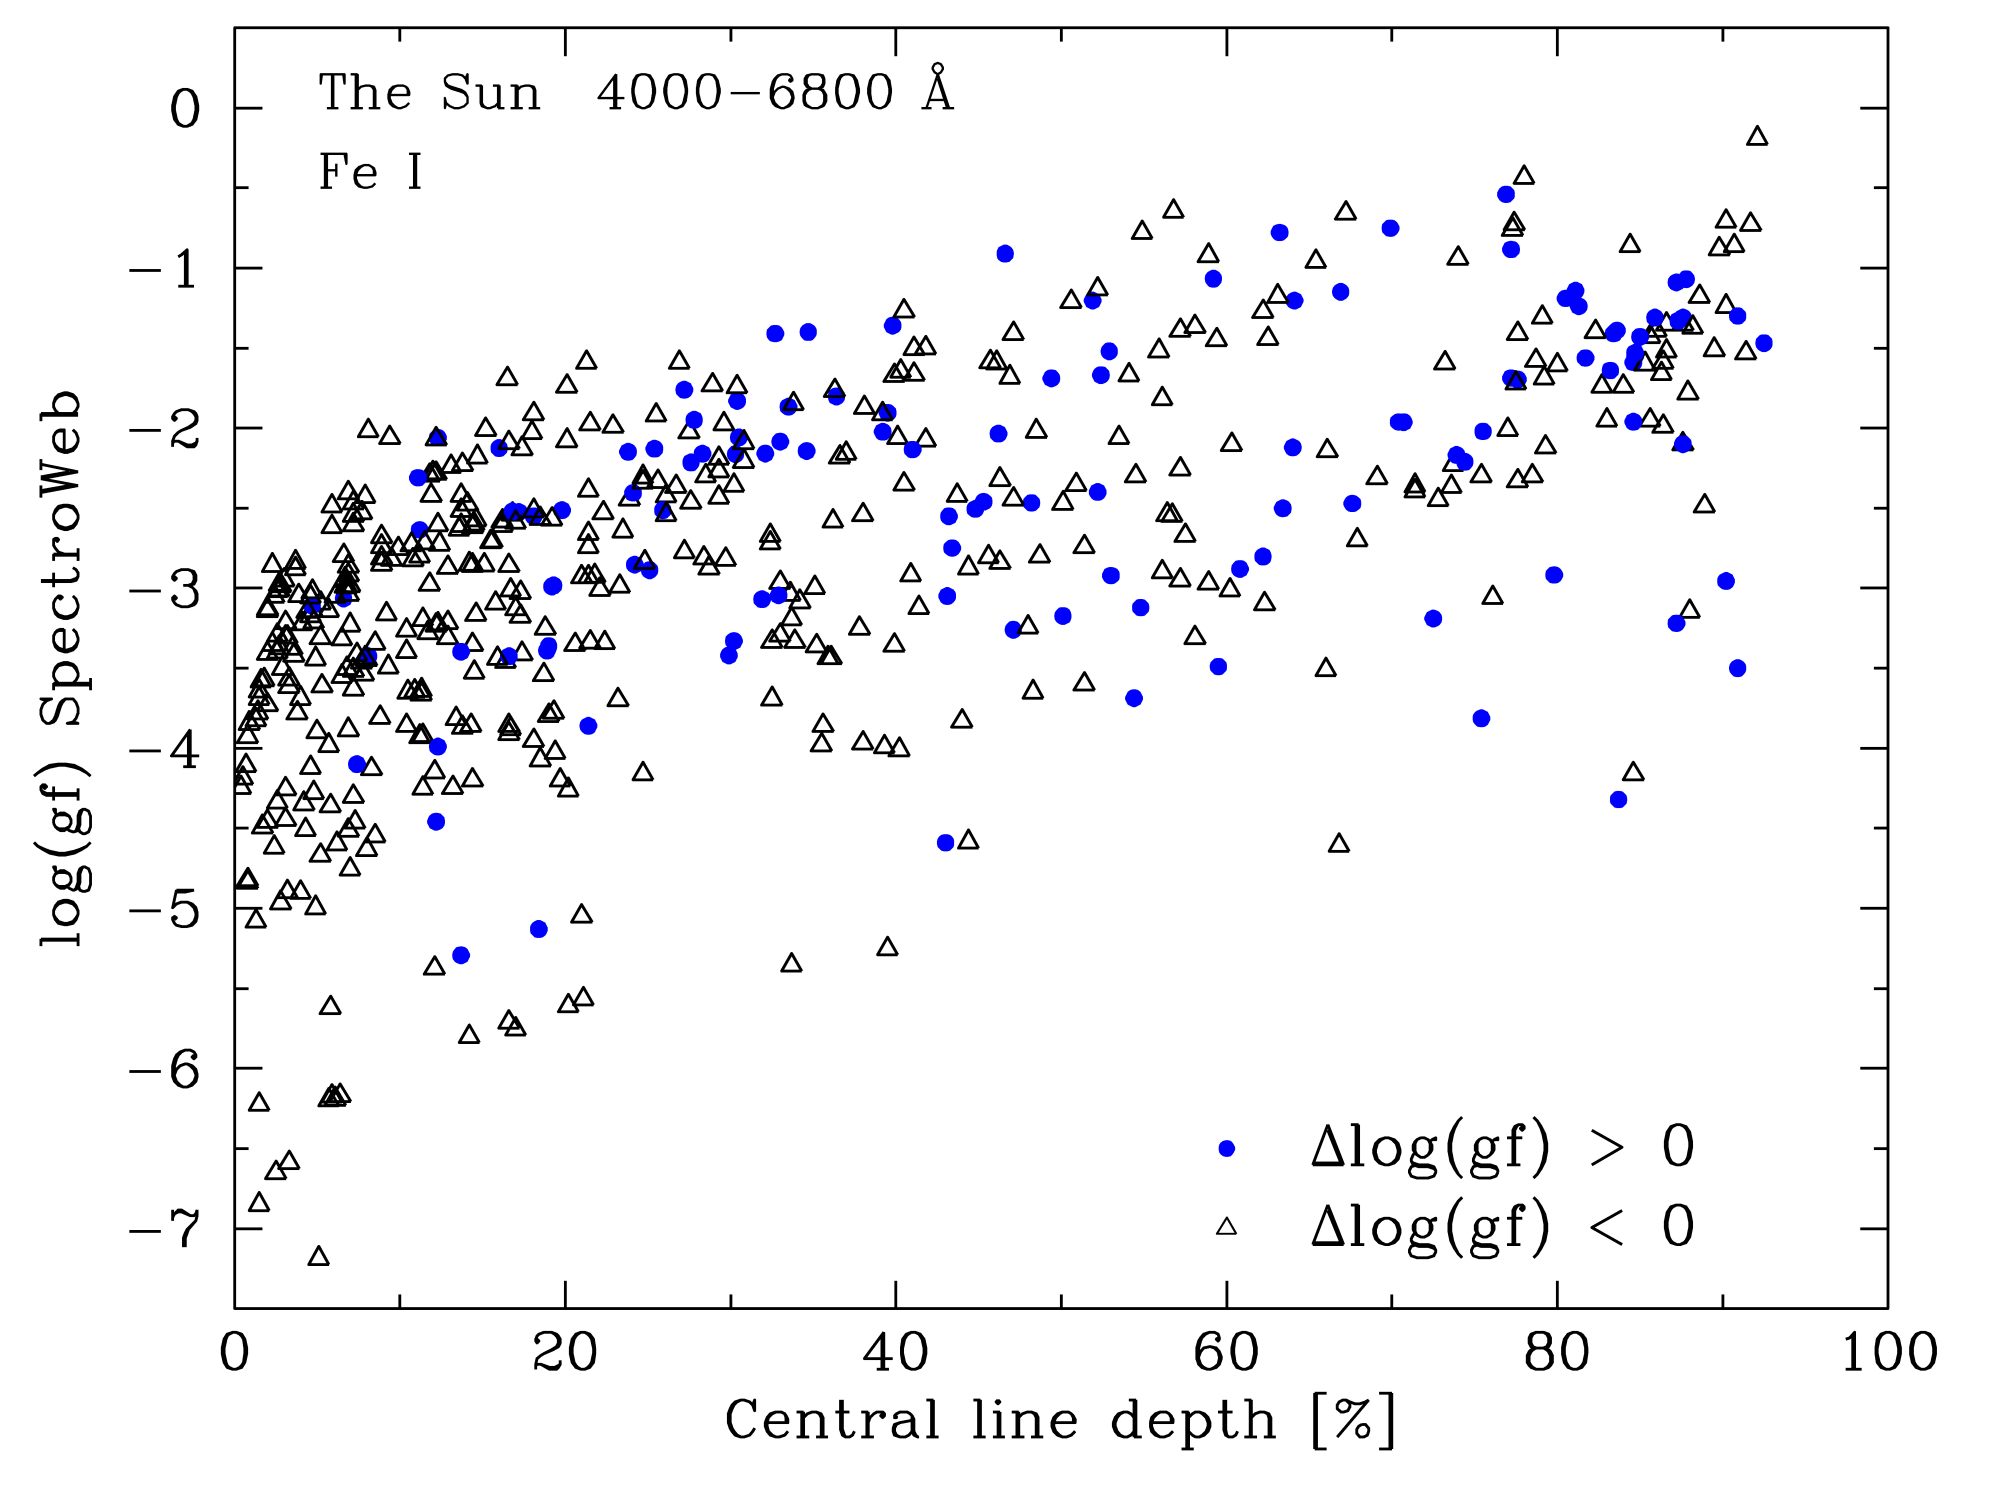
Figure 1: Left-hand panel: Computed normalized central line depths of 1178 atomic absorption lines in the Sun of which the log(gf)-values are measured to fit the observed spectrum. Filled symbols mark neutral iron lines.
Right-hand panel: Log(gf)-values of Fe I lines in SpectroWeb measured from detailed spectral synthesis fits
to the solar optical spectrum against the computed central line depth. Open symbols mark lines of which the log(gf)-value is decreased
compared to the literature value. Significantly more weak lines require a log(gf) decrease than an increase (filled symbols).
Read more: The SpectroWeb Database
Read more: Scanspec Code Development
Selected Papers
- Lobel, A., 2008, SpectroWeb: Oscillator Strength Measurements of Atomic Absorption Lines in the Sun and Procyon, 9th Int. Coll. on Atomic Spectra and Oscillator Strengths for Astrophysical and Laboratory Plasmas at Lund, Sweden, August 7-10, 2007. Journal of Physics: Conference Series, Volume 130, Issue 1, pp. 012015. PDF ADS
- Lobel, A., 2007, SpectroWeb: An Interactive Graphical Database of Digital Stellar Spectral Atlases, in "The Ultraviolet Universe: Stars from Birth to Death", 26th meeting of the IAU, Editorial Complutense Univ. of Madrid, ed. A. Gomez de Castro and M. Barstow, 167, Aug 2006, Prague, Czech Republic. PDF ADS