Co-rotating Interaction Regions in Winds of Massive Hot Stars
Research
Discrete Absorption Components (DACs) observed in the broad P Cygni profiles of UV resonance lines are important tracers of the dynamics of line driven winds in massive hot stars. DACs are observed to propagate bluewards through the UV line profiles on time scales comparable to the stellar rotation period. Hydrodynamic models of Co-rotating Interaction Regions (CIRs) have been proposed to explain the observed DAC properties qualitatively. These large-scale wind structures are spiral-shaped density- and velocity-perturbations winding up in or above the plane of the equator that can extend from the stellar surface to possibly several tens of stellar radii. The CIRs can be produced by intensity irregularities at the stellar surface, such as dark and bright spots, magnetic loops and fields, or non-radial pulsations. The surface intensity variations alter the radiative wind acceleration locally, which creates streams of faster and slower wind material.
We investigate to what extent the CIR wind model can quantitatively explain the detailed DAC properties observed in B0.5 Ib supergiant HD 64760. Exceptional IUE data from the MEGA campaigns have made it a key object for studying the origin and nature of hot-star wind variability. For this purpose we developed a new 3-D radiative transfer code Wind3D to best fit the DAC morphology (e.g. shape and flux changes) observed in the unsaturated absorption portion of the Si IV 1395 resonance line.
Results
For the hydrodynamic CIR models a local radiation force enhancement (or surface `spot') is introduced at the base of the stellar wind. The resulting equatorial density- and velocity-structures are inserted around the star with a thickness of 1 R* around the equatorial plane. Outside this region, the model density and velocity assume the smooth wind values. The left-hand panel of Fig. 1 shows the density enhancement in the wind with respect to the smooth wind density due to a single bright spot at the surface. The spot rotates counter-clockwise with a rotation period 2.5 times longer than the stellar surface rotation period (v_sp = v_rot / 2.5). The right-hand panel of Fig. 1 shows the absorption portion of the Si IV 1395 P Cygni line profile computed with Wind3D for an observer in the plane of the equator observing the model from the left-hand side of the image (red rectangle). Time runs upward in the sequence of computed line profiles. Around rotation phase 0.5 the CIR structure begins to rotate in front of the stellar disk which yields an opacity enhancement in the smooth expanding wind. It enhances the line absorption in the P Cygni profile shifting from low-velocity wind regions close to the star to regions farther out in the wind with larger outflow velocities. The CIR wind structure therefore produces a DAC in the wind profile that drifts from small to large velocities. View the animation in the caption of Fig. 1.
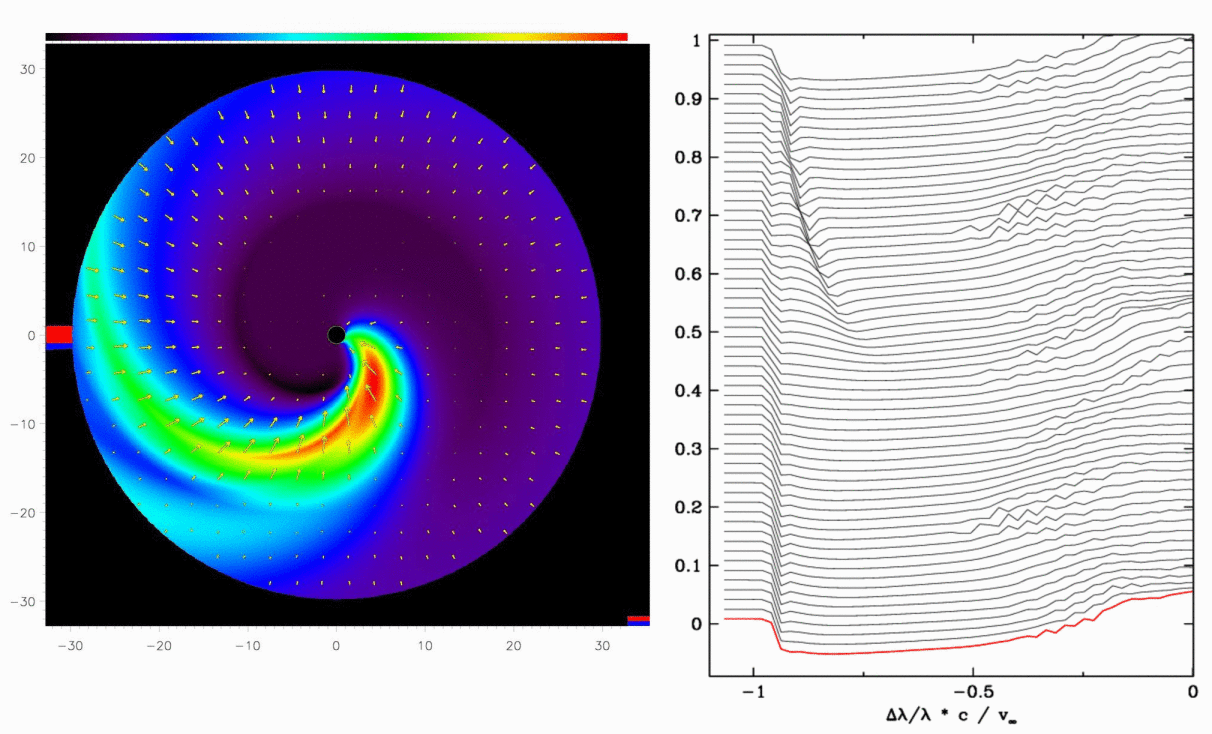
Figure 1: Left-hand panel: Wind model of a hot star with one CIR in the plane of the equator due to a
rotating bright spot at the stellar surface. Right-hand panel: The CIR density- and velocity-structure perturbs the smooth accelerating wind and causes a Discrete Absorption Component in the absorption portion of P Cygni line profiles that form in the hot star wind. View animation.
In Fig. 2 the angular spot diameter Phi_sp is increased from 90 to 180 degrees. The spot co-rotates with the stellar surface (v_sp = v_rot), and the spot intensity is 50% larger than the stellar surface intensity (A_sp=0.5). The increase of the spot diameter considerably alters the FWHM evolution of the DAC computed in the absorption portion of the Si IV 1395 P Cygni line profile. The DAC base broadens because extra wind material injected by the spot becomes more spread out over the equatorial plane. The maximum of the density contrast in the CIR occurs within ~5 R* above the stellar surface. Inside this region extra wind material is distributed over a larger geometric region above the bright spot, which also considerably broadens the density contrast in the tail of the CIR. When this region rotates in front of the stellar disk (around rotation phase 0.2 in the dynamic spectra) the DAC base broadens because the range of velocities projected in the observer's line of sight (that contribute to the DAC opacity) increases. The wind streams almost radially through the CIR density structure. The wind flow decelerates due the relative increase of wind density in a region behind the CIR density contrast maximum. It causes a trailing velocity plateau (between the star and CIR) which strongly contributes to the DAC absorption at larger distances from the star.
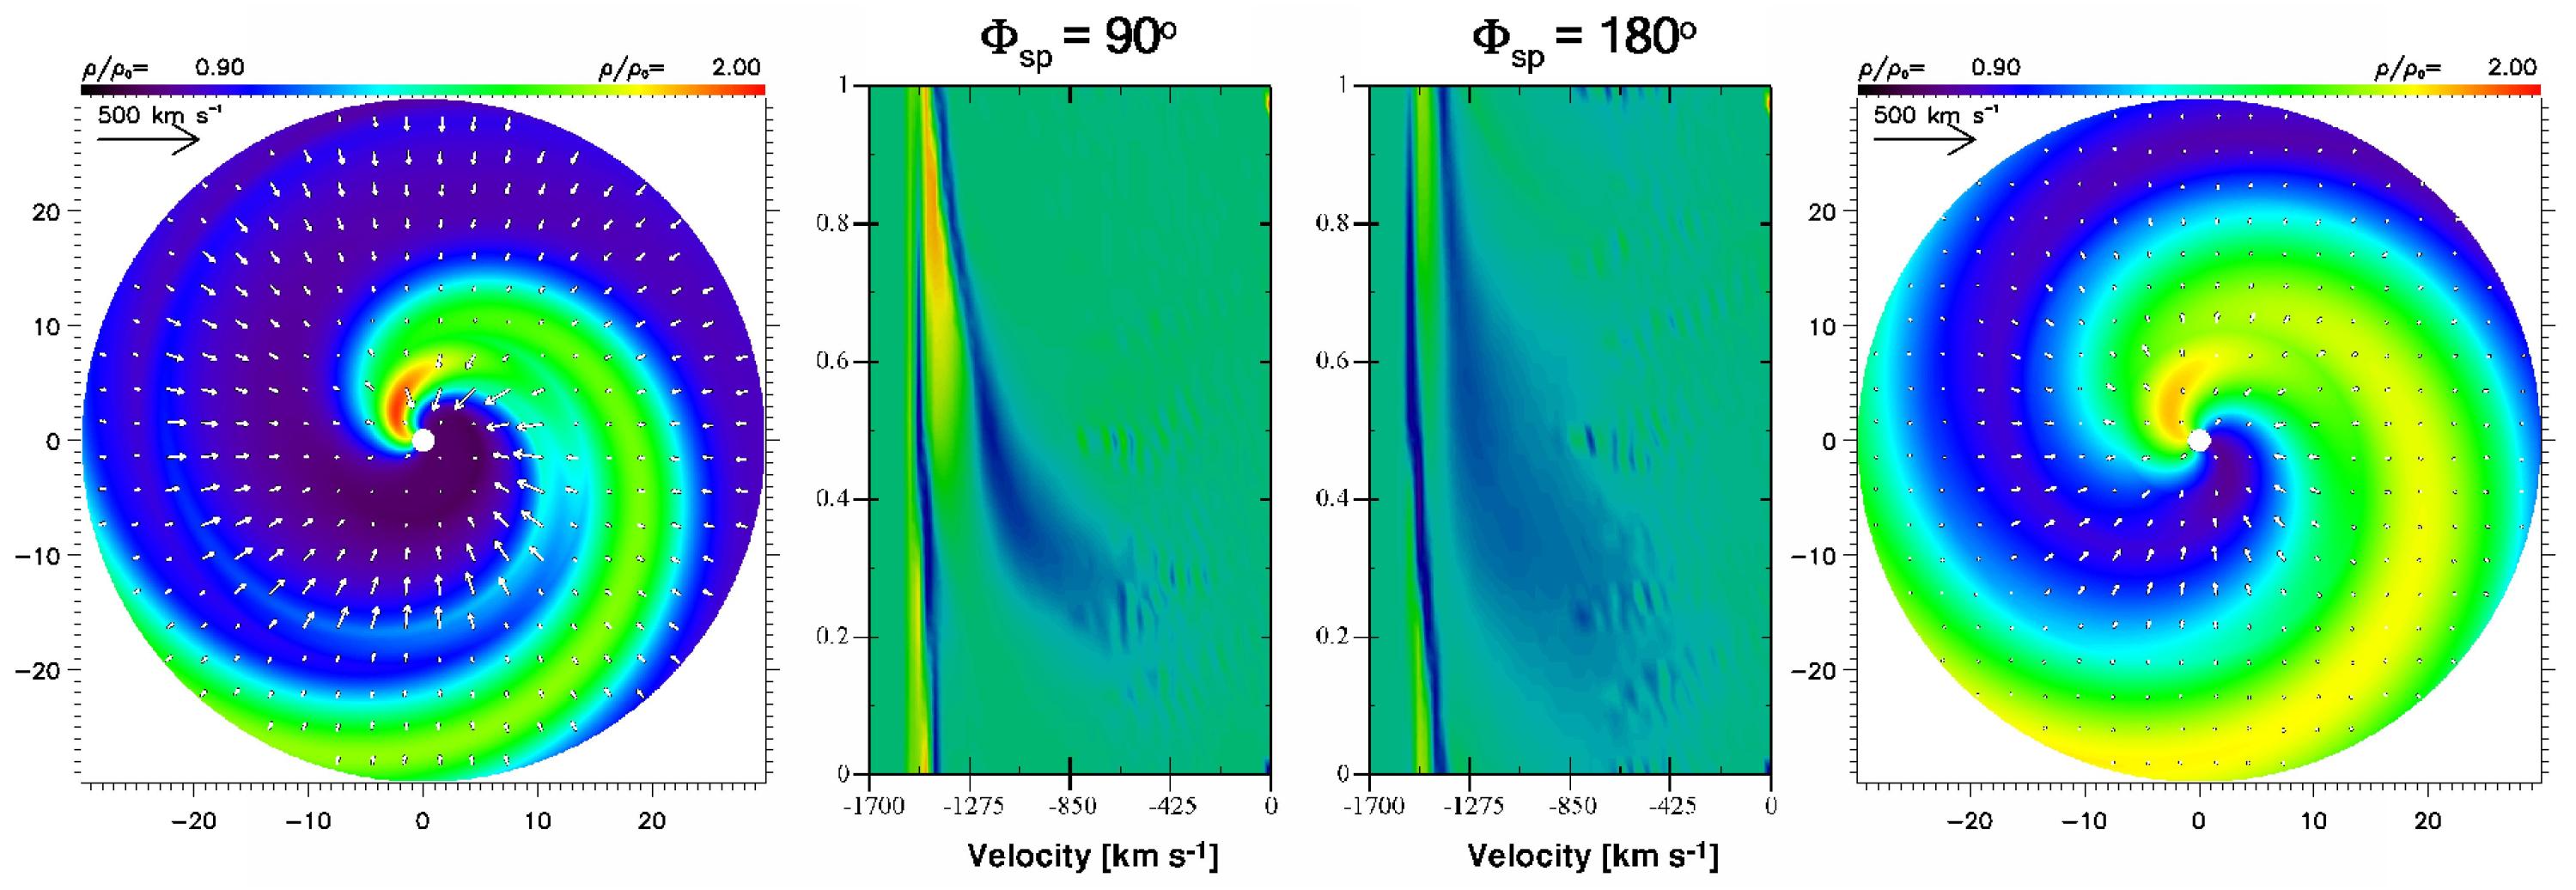
Figure 2: Hydrodynamic CIR models for spot angular diameters Phi_sp=90 degrees (left-hand panel) and 180 degrees (right-hand panel). The dynamic spectra (middle panels) reveal width changes of the DAC base for an observer viewing the rotating models from the south side of the images in the equatorial plane (see text).
The middle panel of Fig. 3 shows the best fit for a two-spot model with v_sp = v_rot / 5 to the DACs observed in HD 64760 (right-hand panel of Fig. 3). Hydrodynamic models with two unequal spots (left hand panel of Fig. 3) significantly better match the detailed DAC shape compared to one-spot models. The spot parameters are varied separately until the best fit to the detailed shape and morphology of the observed upper and lower DAC is accomplished. We find the best fit to the lower DAC with a spot of A_sp=0.2 +/- 0.05 and Phi_sp = 20 +/- 5 degrees. The upper DAC is best fit with a second spot inserted on the opposite side of the stellar equator with A_sp=0.08 +/- 0.05 and Phi_sp = 30 =/- 5 degrees. The computed flux minima in the best two-spot fit to the lower DAC correctly match the almost constant drift observed for its flux minima over time. The shape of the upper DAC flux minima is somewhat more curved (but less sharply defined due to the horizontally intersecting rotational modulations), while its base is slightly more blue-shifted compared to the lower DAC. The upper DAC is therefore best fit using a somewhat larger Phi_sp = 30 degrees. The larger spot diameter used for the upper DAC broadens the computed width at its base and shifts the velocity positions of the flux minima very close to the observed values. The velocity extension of the upper DAC base somewhat decreases by reducing A_sp to 0.08 compared to the lower DAC.
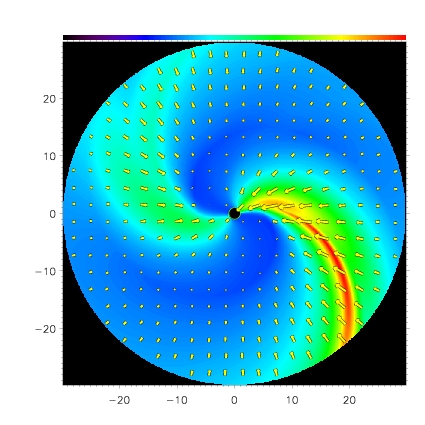
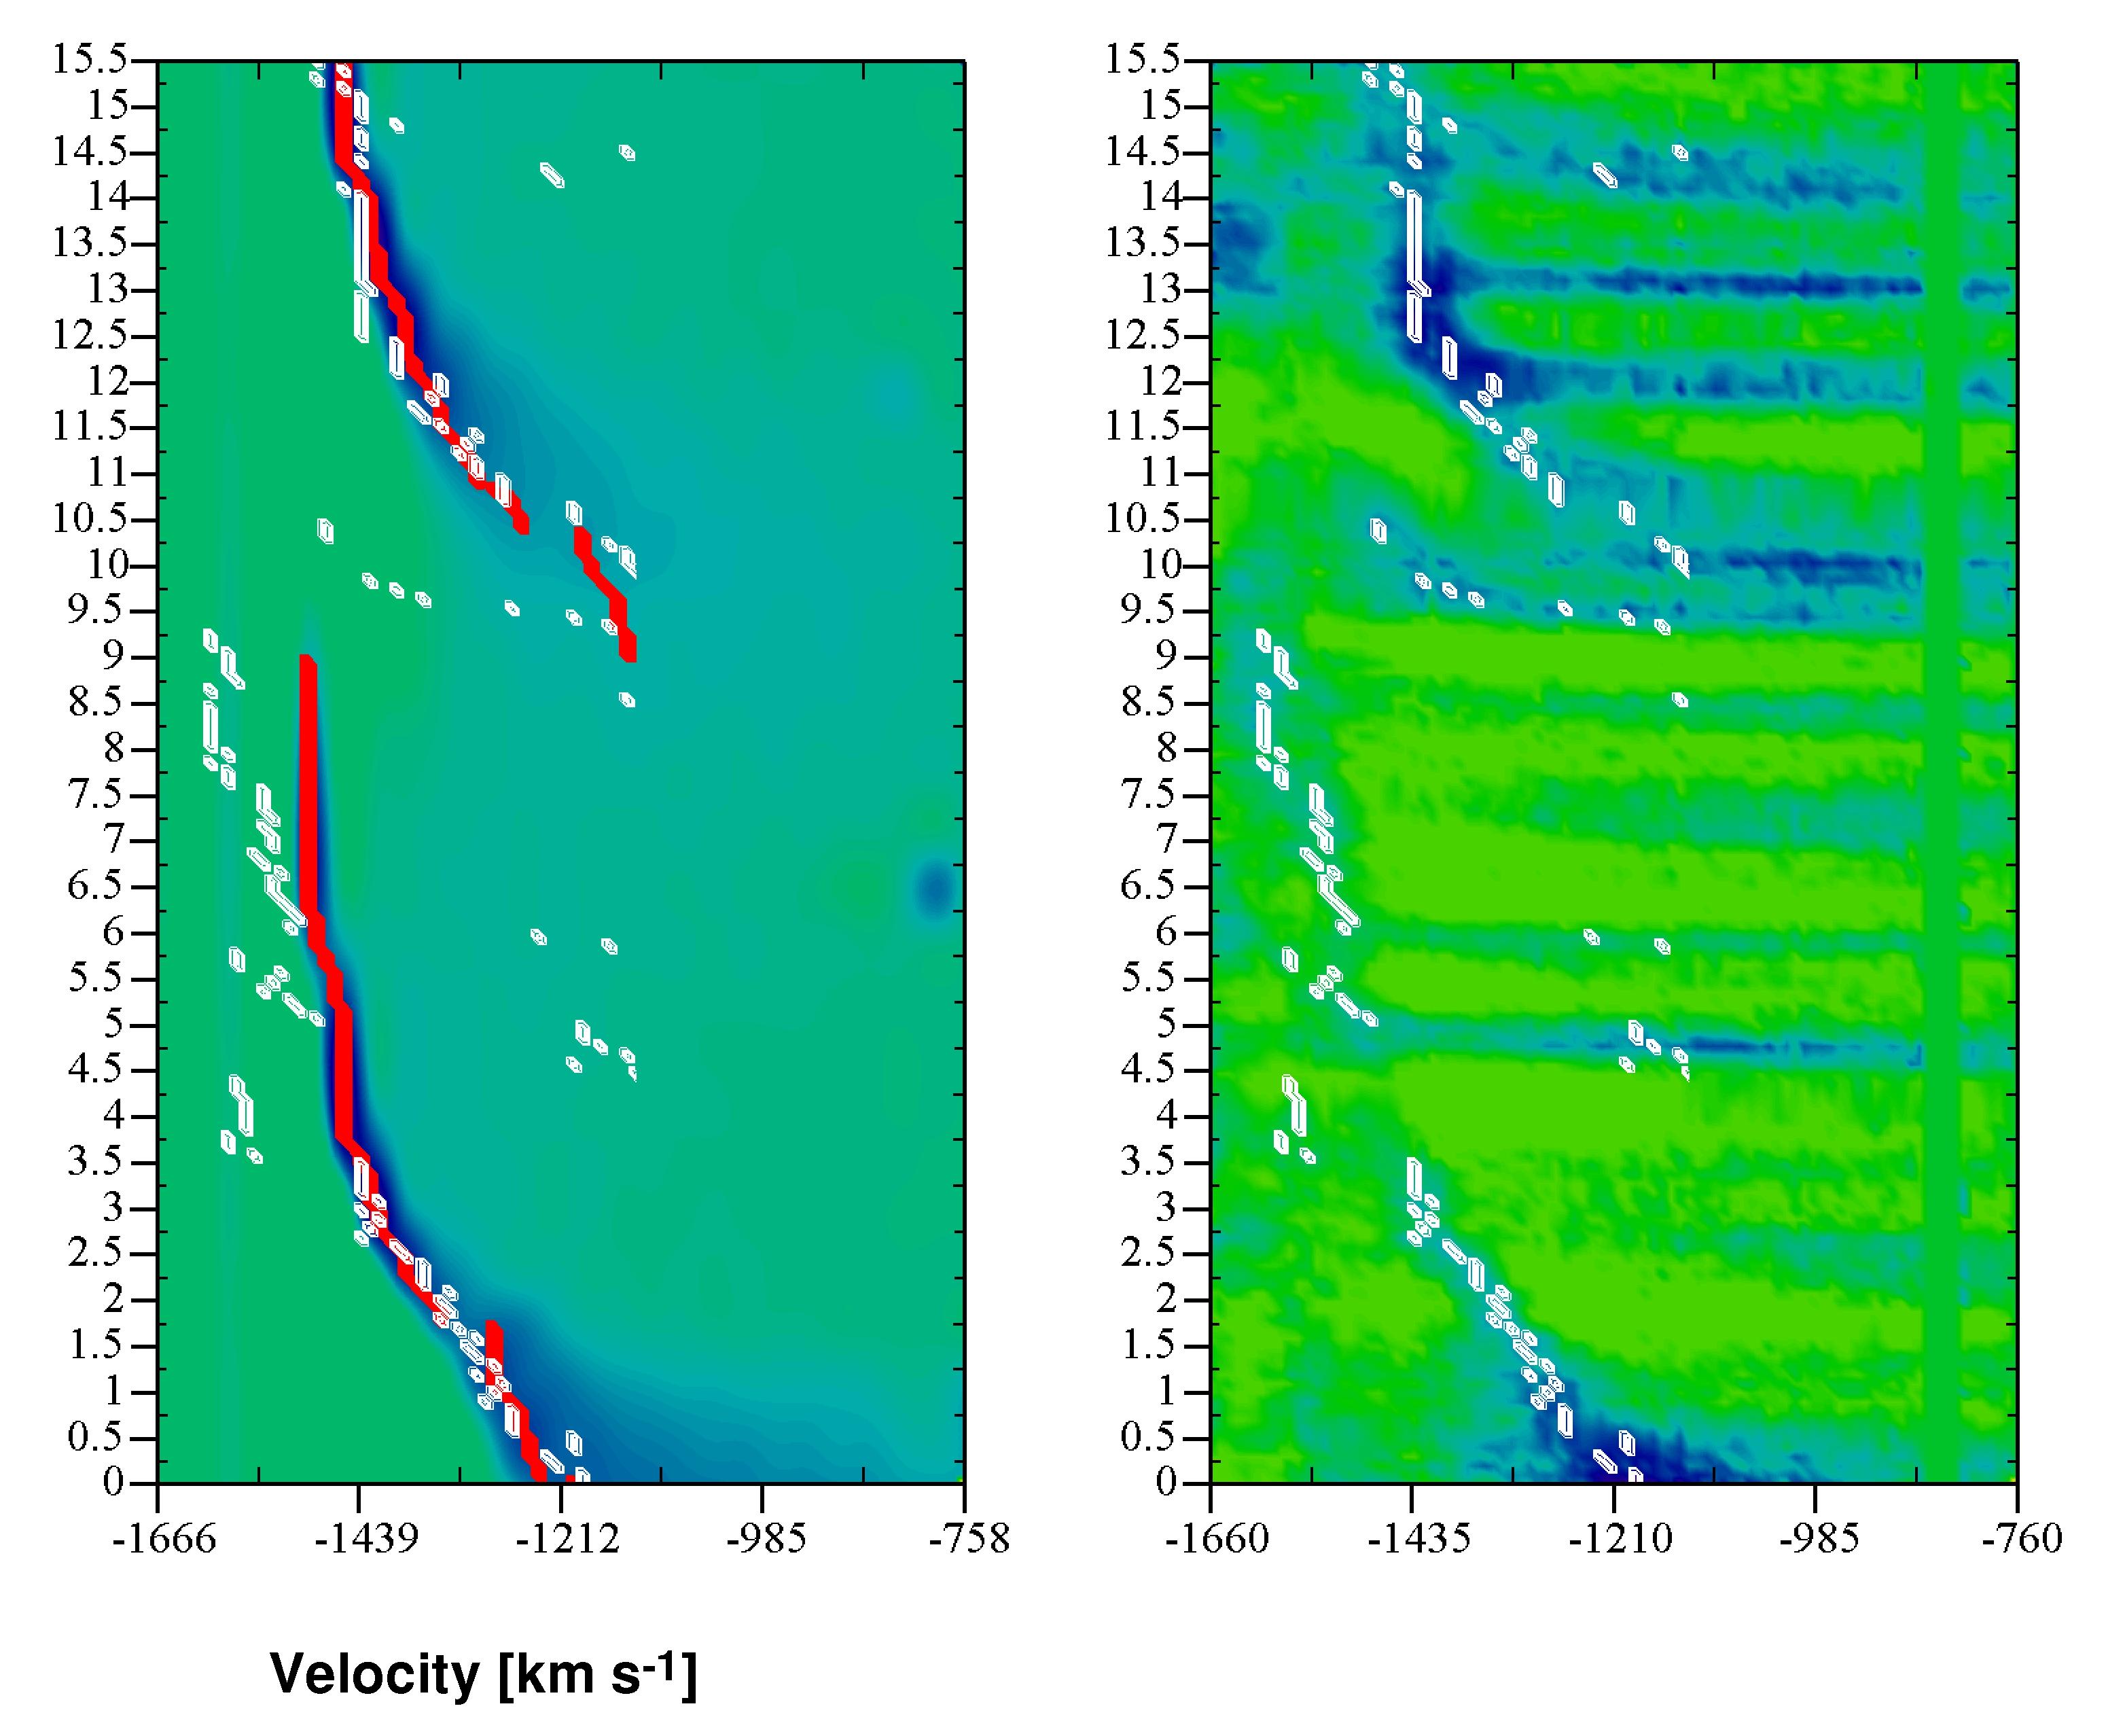
Figure 3: Left-hand panel: Hydrodynamic wind model with large-scale density- and velocity-structures
computed for HD 64760 to best fit the DACs observed in Si IV 1395. The bright spots at the equator
are 20% and 8% brighter than the stellar surface, having anglar opening diameters of 20 and 30 degrees, respectively,
rotating 5 times slower than the surface. The spots produce wind structures with density enhancements in
CIRs compared to the smooth wind density. The minimum density contrast is 0.87 (blue color),
increasing to a maximum value of 1.32 (red color). The size of the over-plotted arrows indicates
the magnitude of the velocity deceleration with respect to the smooth unperturbed wind.
The maximum velocity difference in the CIRs compared to the smooth wind does not exceed ~140 km/s.
The bright spots cause density waves in the equatorial rotating wind. View animation.
Middle panel: The best fit dynamic spectrum of Si IV 1395 for the two-spot model
compared to the observed spectrum (right-hand panel) of HD 67460. Time T runs upwards.
The shape and morphology
of the computed DACs fit the properties of the observed DACs. The velocity positions of the
computed DAC flux minima (red dots) are very close to the observed minima (white dots).
The FWHM of the computed DAC decreases from ~100 km/s at T=0 d
to ~20 km/s around T=3.5 d, in agreement with the narrowing of the observed DAC.
The lower DAC width remains almost constant over the following 6.5 d, after which it fades away.
This `tube-like' extension of the DAC base is also observed (right-hand panel), but somewhat
exceeds the computed DAC velocities after T=7 d.
Read more: Wind3D Code Development
Link To: Hydrodynamic Simulations of Hot-Star Winds at ROB (with more animations)
Link To: Royal Observatory of Belgium Press Release Dec 08: Hottest Stars in Delicate Embrace by Spiral Arms
Selected Papers
- Lobel, A., & Blomme, R., 2008, Modeling Ultraviolet Wind Line Variability in Massive Hot Stars, The Astrophysical Journal, 678, 408. PDF ADS
- Lobel, A., 2008, Modeling DACs in UV Lines of Massive Hot Stars, in "Clumping in Hot Star Winds", ed. W.-R. Hamann, A. Feldmeier & L. Oskinova, (Potsdam: Univ.-Verlag), URN: http://nbn-resolving.de/urn:nbn:de:kobv:517-opus-1398, p. 81. PDF ADS
- Lobel A., & Blomme, R., 2006, Three Dimensional Radiative Transfer in Winds of Massive Stars: Wind3D, in "The Ultraviolet Universe: Stars from Birth to Death", 26th meeting of the International Astronomical Union, Joint Discussion 4, 16-17 August 2006, Prague, ed. A. Gomez de Castro and M. Barstow (Madrid: Editorial Complutense Univ. of Madrid) pp 167-172. PDF astro-ph