Dusty Code
Code Development
The Dusty code computes the transport of radiation in the dusty circumstellar environments of cool stars. The Dusty code is originally due to Ivezic, Nenkova & Elitzur (1996). It solves the radiation transport equation coupled self-consistently with the equation of motion for the outflow of gas and dust grains. The radiation from the star is scattered, absorbed and re-emitted by dust, and the emerging processed spectrum often provides the only available information about the embedded star. Dusty has built-in optical properties for the most common types of astronomical dust, and comes with a library for many other grains. It supports various analytical forms for the density distribution, and can perform a full dynamic calculation for radiatively driven winds, for example around AGB stars. The code handles both planar and centrally-heated spherical density distributions. The number of independent input model parameters is minimized by fully implementing the scaling properties of the radiative transfer problem, and the spatial temperature profile is found from radiative equilibrium at every point in the dusty region. The spectral energy distribution of the source can be specified analytically as either blackbody or broken power-law. In addition, arbitrary dust optical properties, density distributions and external radiation can be entered in user supplied files.
The assumption of a blackbody for the central star for the detailed modeling of the spectral energy distribution of cool stars is however not correct. In cool star atmospheres strong flux differences occur between the stellar continuum flux and the emerging atmospheric flux due to strong molecular opacity sources (H, C, N, O compounds). These differences of the flux distribution from the central star, after being reprocessed through the dust shell, greatly affect the resulting spectral energy distribution from which the properties of the dusty envelope are to be derived. I therefore updated the Dusty code with routines in which the complete synthetic input spectrum of the central star is redistributed with frequency dependent radiative transfer calculations through a model of a spherically symmetric dust envelope. The photon radiation momentum transfer drives the envelope expansion which determines its density structure and the correspondig stellar mass-loss rate. The radiative transport calculations consider stationary outflow of dust which drags the ambient gas along. The resulting density- and temperature-structure (starting from the dust condensation point) are monotonically decreasing functions of distance in the dust shell. The absorption and scattering efficiencies of the dust are evaluated via the Mie theory for grains treated as homogeneous spheres.
Results
Detailed spectral energy distribitions computed with Dusty using synthetic input spectra are shown in the left-hand panel of Fig. 1 for the notorious carbon star R Fornacis. We apply a search technique through a grid of stellar input spectra with various values of the effective temperature and gravity acceleration that are redistributed through a grid of models for the dust envelope until a best fit between the observed and computed flux of the 11 micrometer dust emission feature is obtained. The usual assumption of a blackbody for the stellar radiation field is abandoned because atmospheric molecular and atomic line blanketing in cool giants like R For have strong effects on the shape and fluxes of the output spectrum. These opacity sources also affect `synthetic' broadband photometry we compute from the spectra redistributed by the dust envelope by convolution with the transmission functions in different optical and near-infrared passband filters. The dust shell parameters are determined with a least-squares search on the observed broadband photometry in conjunction with a best fit to the intensity and shape of dust emission feature observations.
In the right-hand panel of Fig. 1 we model flux and shape changes observed in the silicate dust emission feature of Mira (omi Ceti) for different pulsation phases. From a combination of variable near-IR spectra and spectro-photometric observations of the 9.7 micrometer silicate dust emission feature in different variability phases we study the influence of the changing atmospheric circumstances on the conditions in the circumstellar dust envelope. From detailed modeling of near-IR TiO and VO bands we determine changes of the effective temperature and the atmospheric acceleration of the central star. The corresponding atmospheric model spectra are redistributed through the dust envelope using radiative transfer calculations with Dusty for detailed modeling of the shape changes observed in the silicate emission feature. We find that these shape changes are mainly caused by changes in the flux distribution of the incident stellar radiation field with the pulsations, whereas the intensity changes of the dust emission result from the stellar luminosity changes because Mira is enshrouded by a very optically thin dust shell. For Mira we compute that the effective temperature increases from Teff=2400 K in the minimum brightness phase, to 3000 K (+/-100 K) around maximum phase. The amplified momentum transfer around maximum brightness enhances the acceleration of the dust outflow near the dust condensation radius at ~6 R*. It produces variations of the terminal dust outflow velocity with variability phase at larger distance from the star. The corresponding small changes of flux mean opacity and gas mass-loss rates (from 2.8 to 3.2 10^-7 Msun/yr) are sufficient to model the shape changes observed in Mira's 9.7 micrometer dust emission feature.
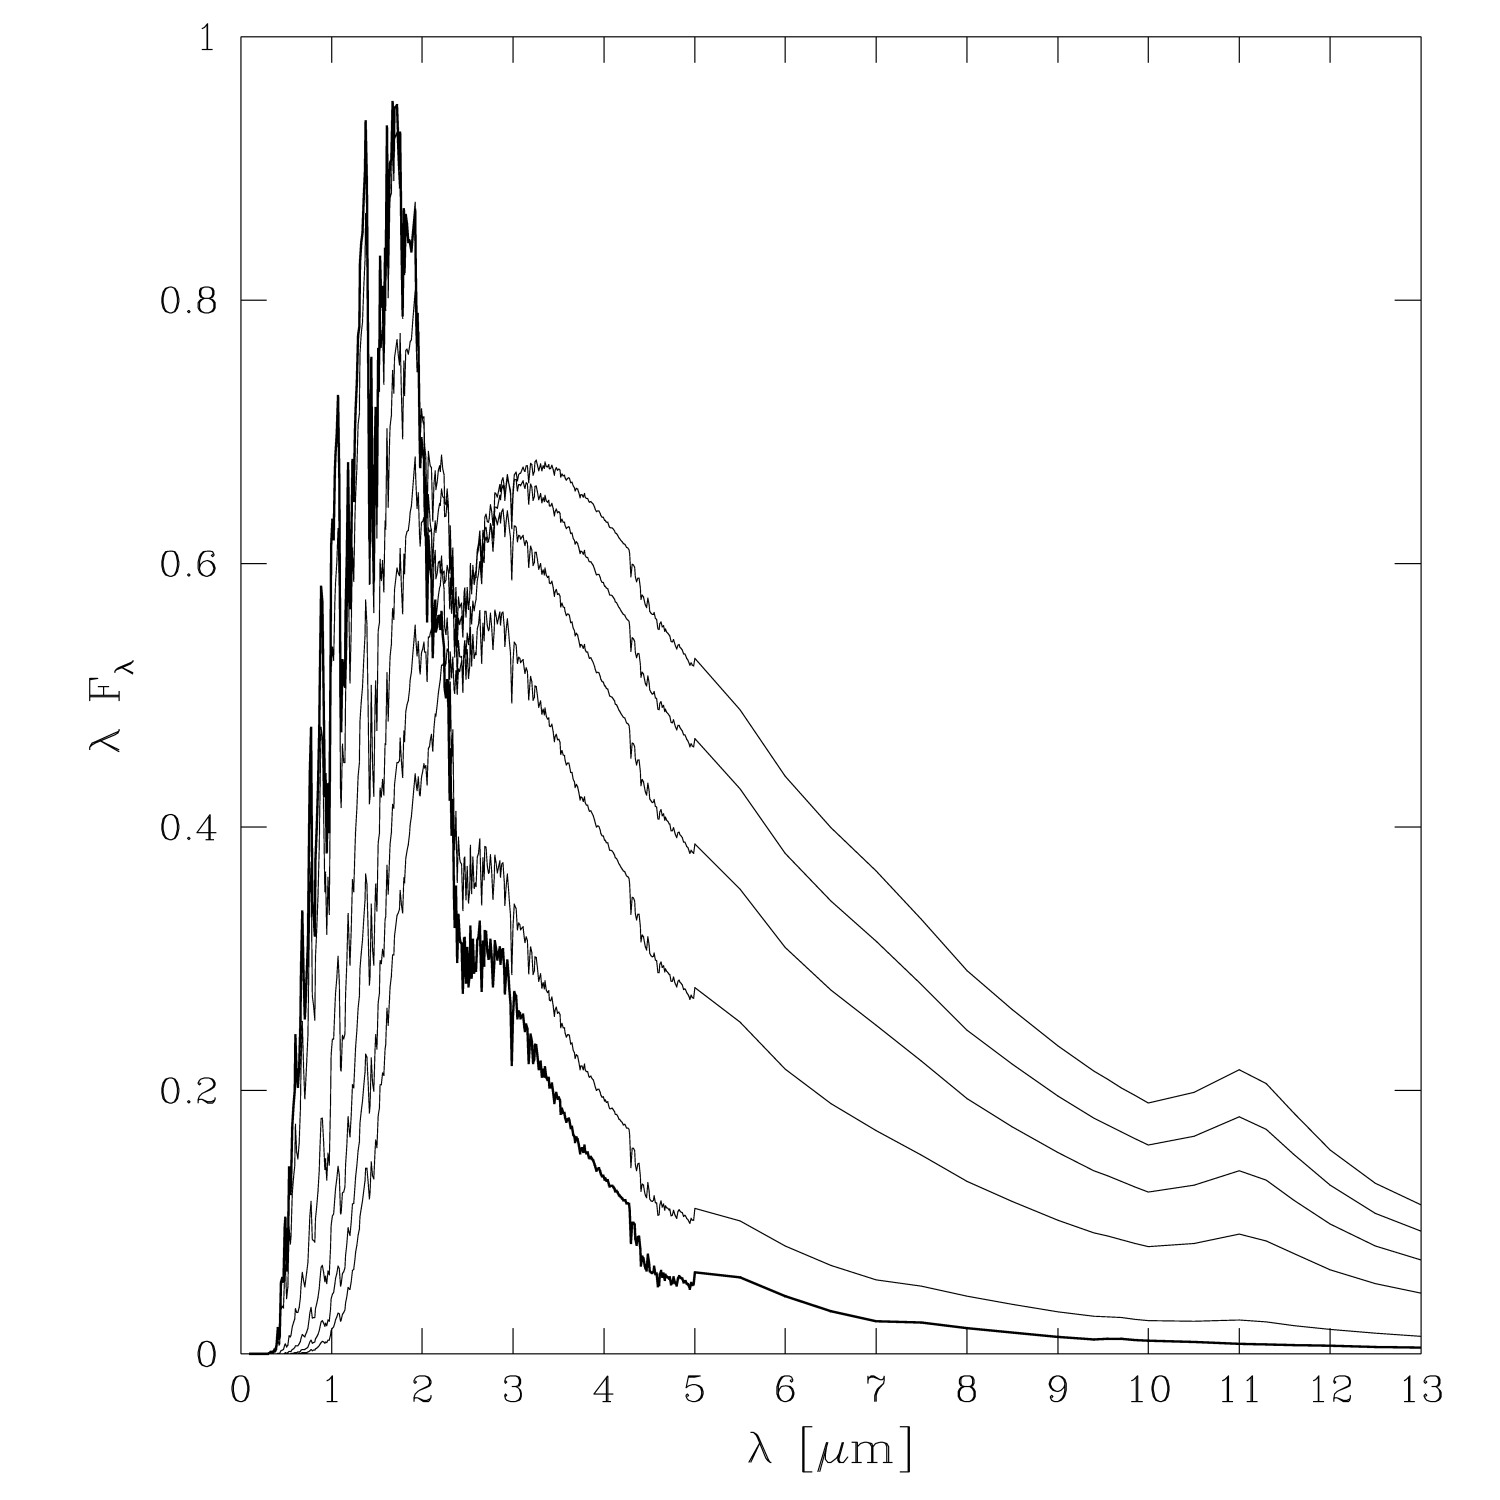
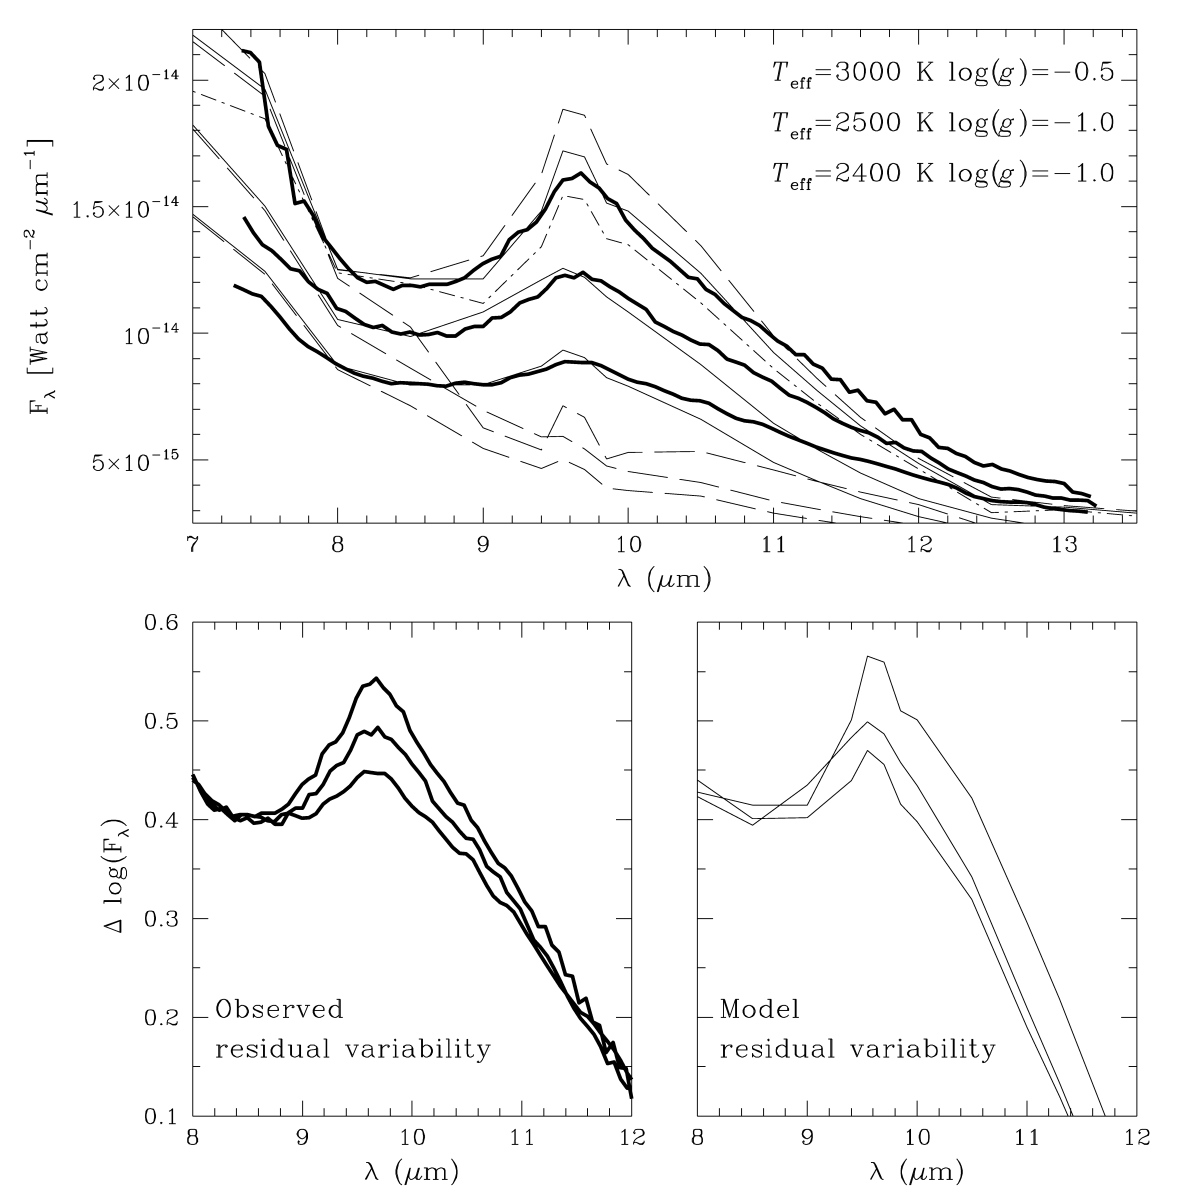
Figure 1: Left-hand panel: The model spectrum (bold drawn curve) of R For is redistributed with
Dusty and shown for five increasing optical depths for its dust envelope at 11 micrometer of 0.01, 0.05, 0.105,
0.15, and 0.2 (thin drawn lines upwards). As the dust optical depth increases, the flux at shorter wavelengths
is redistributed more to infrared wavelengths, resulting in stronger SiC dust emission at 11.3 micrometer.
Right-hand panel: Best fits (thin solid drawn lines) to silicate dust emission of Mira observed at
its minimum brightness phase (phi=0.68, 1995 December 2), phi=0.37 (1995 August 20), and near
maximum light phi=0.29 (1994 August 26) (bold solid drawn lines). The corresponding input spectra
are shown by the dashed lines for Teff=2400 K, 2500 K, and 3000 K, respectively.
The observed variations in absolute flux result from changes in the bolometric flux
of the stellar input spectrum with variability phase. In the maximum phase the shape of the dust emission
feature is best fit for 3000 K, but it is too weak for 2900 K (dash-dotted line) and too intense for 3100 K
(dashed line). Lower left panel: The luminosity changes of the star are removed by matching
the observed flux levels in different phases at 8.5 micrometer in the logarithmic
scale. Lower right panel: The corresponding residual changes in the dust emission shape
result from small variations of the dust acceleration with changes of Teff and the flux mean
optical depth of the circumstellar dust envelope. The best fits are obtained
without changes of the grain composition, grain size distribution, or temperature
and distance at the dust condensation radius with pulsation phase.
The model parameters of Betelgeuse's inner circumstellar dust envelope are also accurately determined using radiative transfer calculations with Dusty that consider the red supergiant's detailed stellar input spectrum. The right-hand panel of Fig. 2 shows the best fit to the weak silicate dust emission feature observed at 9.8 micrometer with IRAS (or ISO). The detailed photospheric input model with Teff=3500 K and log(g)=-0.5 is redistributed through a spherical model of the circumstellar dust envelope. The best fit yields an inner dust condensation radius Rc of 573 milli-arcseconds (or ~23.2 R*), where the mass density is around 5 x 10^-16 gr/cm^-3 for the cool ambient gas component. The canonical value of 200 for the gas-to-dust density ratio is assumed, although an order of magnitude larger can still be adopted for this cool supergiant star. The best model fit yields a silicate dust condensation temperature Tdust below 600 K (blue solid drawn line), composed of olivine grains with a grain size distribution n(a)=a^-3.5, where the dust grain sizes range between 0.05 and 0.5 micrometer. We compute that the 9.8 micrometer flux optical depth of Betelgeuse's inner dust envelope is small, with a flux mean optical depth at 9.8 micrometer of only 0.015. The left-hand panel of Fig. 2 shows the corresponding best model fit (green drawn line) to the dust surface brightness of the inner circumstellar dust envelope observed in 10 micrometer MMT images out to 4 arcseconds.
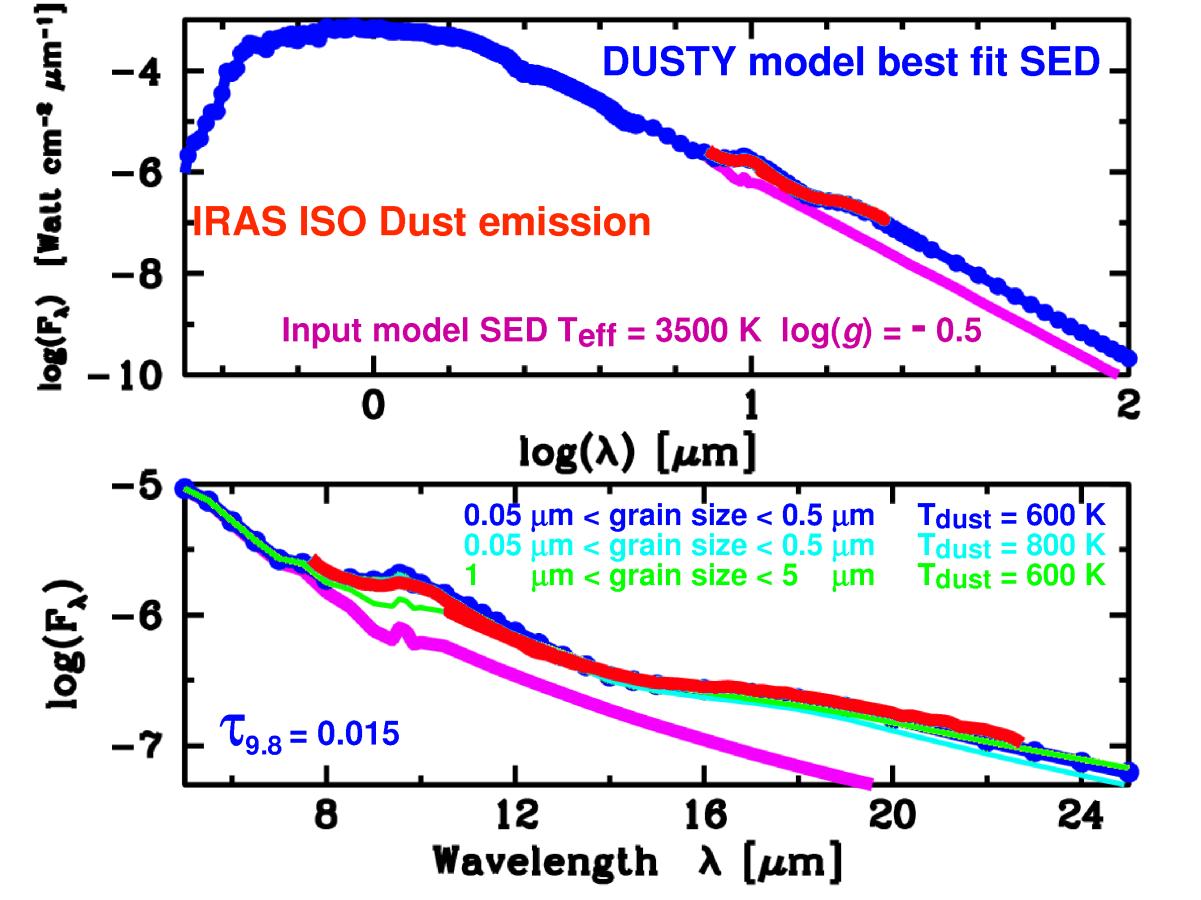
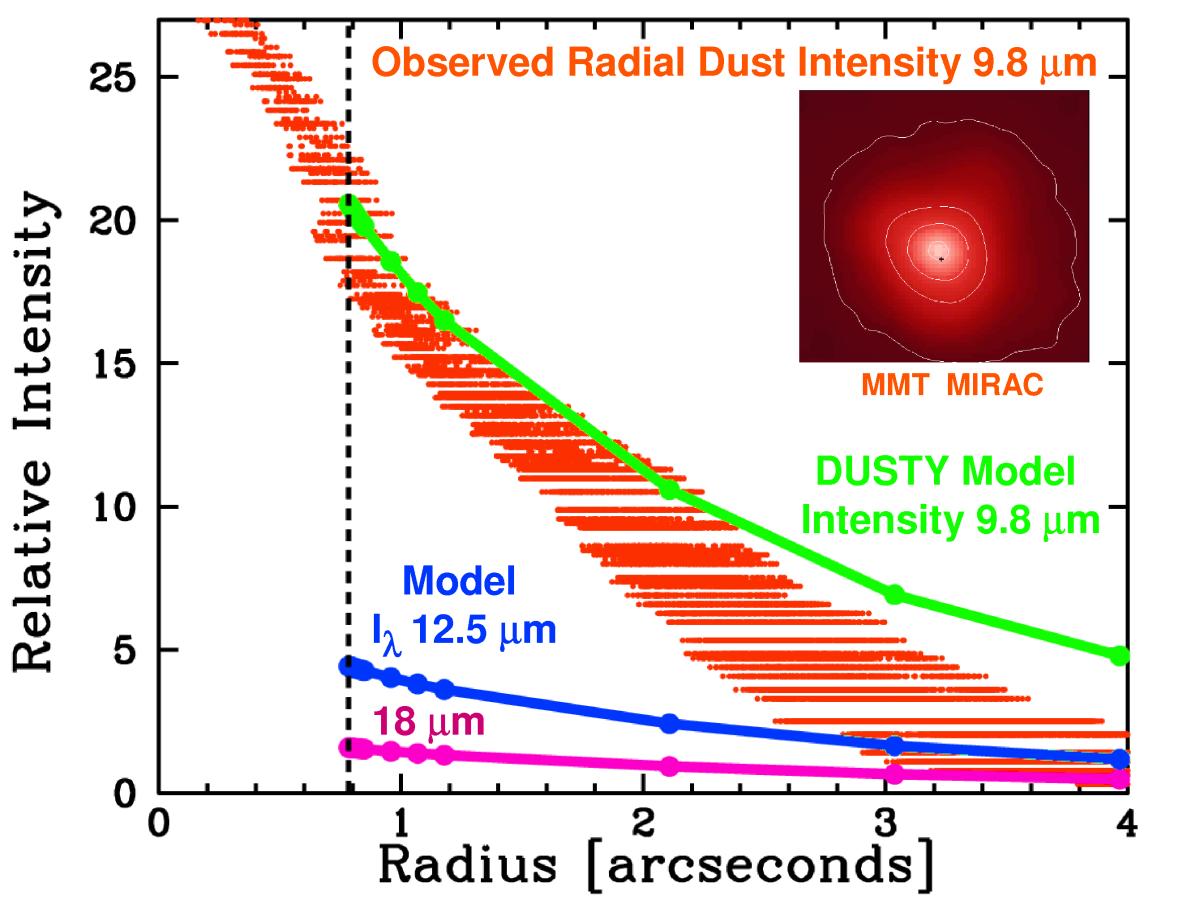
Figure 2: Left-hand panel: Best fit with Dusty (dotted blue line in upper panel) to the
IRAS 9.8 micrometer silicate dust emission of Betelgeuse (red drawn line). The detailed
stellar input spectrum (magenta line) with Teff=3500 K and log(g)=-0.5 is redistributed through
a model of the circumstellar dust envelope. The best fit is obtained for olivine grain composition
(blue line in lower panel) with a dust temperature of 600 K and dust grain sizes between 0.05 and 0.5 micrometer.
The best fit corresponds to a flux mean optical depth of 0.015 for Betelgeuse's dust envelope at 9.8 micrometer.
Right-hand panel: Best fit (green drawn line) with Dusty to the observed 9.8 micrometer radial intensity
distribution of Betelgeuse's inner dust envelope (red dots) from MMT-MIRAC2
images (upper right-hand image). Model radial intensity distributions computed at 12.5 (blue line)
and 18 micrometer (magenta line) are also shown.
Read more: Atmospheric Conditions of Variable Massive Cool Stars
Selected Papers
- Lobel, A., Bagnulo, S., Doyle, J. G., & Power, C. 2000, Monthly Notices of the Royal Astronomical Society, 317, 391, Modelling near-IR Spectra and Mid-IR Dust Emission of Mira Variables at Different Phases. PDF ADS
- Lobel, A., J. G. Doyle, & S. Bagnulo, 1999, Astronomy & Astrophysics, 343, 466, Modelling the Spectral Energy Distribution and SED Variability of the Carbon Mira R Fornacis. PDF ADS
- Lobel, A. 2005, Spatially Resolved STIS Spectroscopy of Betelgeuse's Upper Chromosphere and Circumstellar Dust Envelope, 13th Cambridge Workshop on Cool Stars, Stellar Systems, and the Sun, ESA SP-560, 327, eds. F. Favata et al., Jul 2004, Hamburg, Germany. PDF ADS