Wind3D Code
Code Development
Wind3D is a new and advanced 3-dimensional radiative transfer code I am developing for detailed modeling of physical conditions in the circumstellar environments and winds of stars with extended atmospheres. It solves the radiation transport problem in three geometric dimensions for arbitrary gas density structures and velocity fields. The implementation of Wind3D is based on a finite element method that uses short characteristics in a 3-D Cartesian grid. The FORTRAN code (currently ~5200 lines of tested code) has been developed for high-performance computers with parallel processing. Wind3D is currently implemented as a fully parallelized (exact) accelerated lambda iteration scheme with a two-level atom formulation. It runs on a number of 64-bit multi-CPU compute servers at the Royal Observatory of Belgium. Typical wind model calculations are performed with 71x71x71 grid points on an equidistant mesh. The code lambda-iterates the 3-D line source function to accuracies better than 1 %. The local mean intensity integral currently sums 80x80 spatial angles for 100 wavelength points of the line profile. The non-LTE 3-D transfer equation is solved for 701x701x701 interpolated grid points using a Gaussian profile function. Wind3D has carefully been load balanced for parallel processing utilizing the OpenMP programming strategy, and shows excellent scaling properties for multi-threading. The code accepts arbitrary 3-D velocity fields without assumptions of axial symmetry. The numerical transfer scheme is efficient and very accurate to trace small variations of local velocity gradients on line opacity in strongly scattering dominated supersonic expanding stellar winds.
Results
We compute sophisticated 3-D hydrodynamic models as input for the 3-D radiative transfer calculations with Wind3D. These combined model calculations enable us to investigate the physical properties of time-dependent changes observed in detailed wind profiles of hot massive stars. We use the ZEUS-3D code to simulate the CIRs in the wind. Bright spots on the stellar surface give a greater line force, resulting in enhanced wind density structures extending from the stellar surface to 30 R*. The star rotates with 350 km/s at the surface. We simulate the CIR structures in the plane of the equator of the stellar wind model (see Fig. 1).
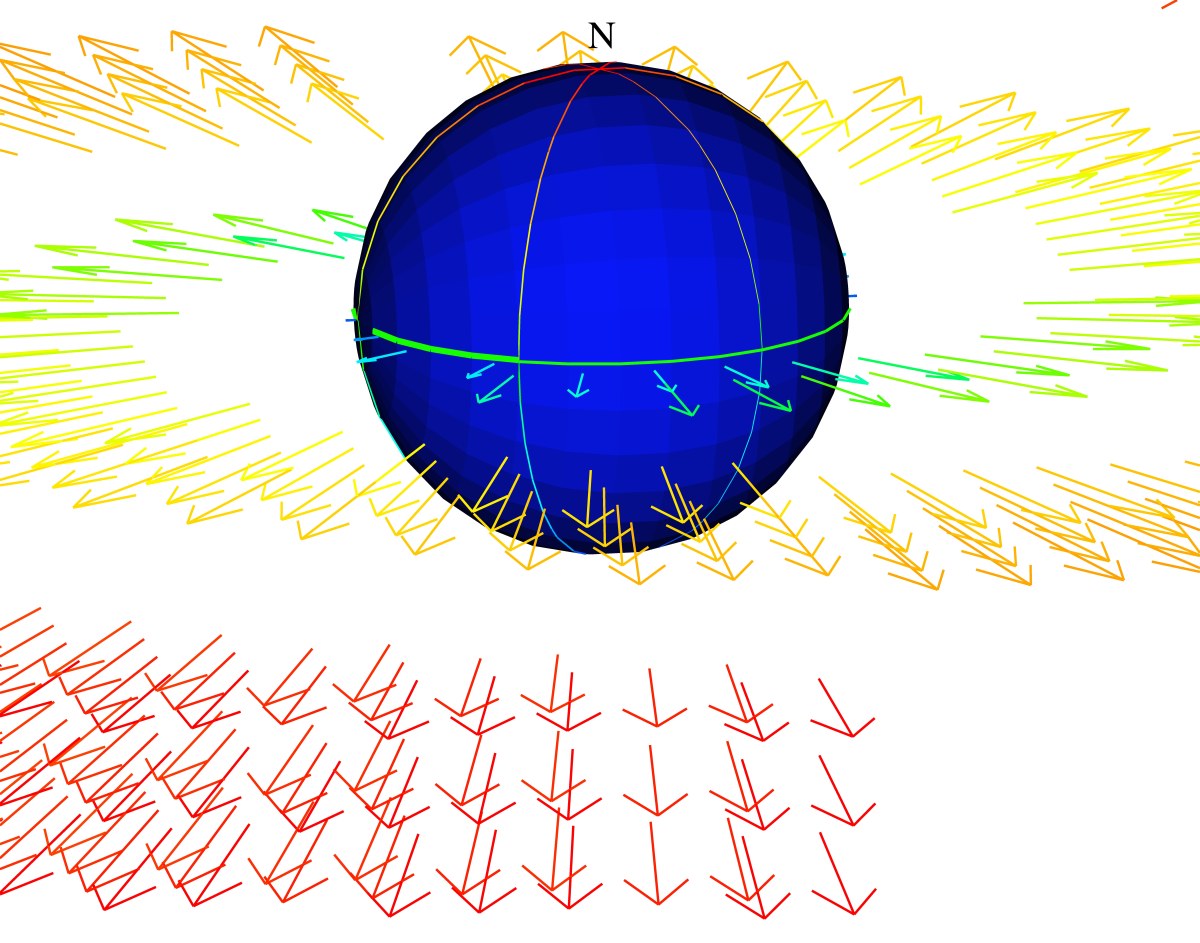
Figure 1: Left-hand panel: Schematic representation of two CIRs in the plane of the equator used in 3D radiative transfer
calculations with Wind3D.
Right-hand panel: Schematic drawing of a parameterized structured wind model for Wind3D. The simulation box size is
24 R*, with the hot star at box center. The smooth stellar wind is radially symmetric with a beta-power velocity law
(blue arrows). The local velocities inside the CIRs also assume the beta-law of the ambient wind, but the velocity vectors
are drawn with much finer spacing (green, yellow, and red arrows). The height of the CIRs above and below the plane
of the equator is set to 1/2 R*. The wind model rotates over one period and is viewed by the observer in the plane
of the equator for the calculated line profiles in Fig. 2.
The theoretical spectral line calculations with Wind3D are compared to the dynamic spectrum of the Si IV 1394 doublet lines observed in the IUE MEGA Campaign of 1995 of the early B-type Ib supergiant HD 64760. We infer the detailed physical and geometric properties of the CIRs from the DACs observed in these Si IV line profiles. The DACs are recognized as rather narrow absorption features that drift towards shorter wavelengths. The DACs drift toward larger velocities because the observer probes regions of enhanced wind absorption inside one spiral arm at increasing distances from the stellar surface while the entire structure rotates through his line of sight. Another important result of this modeling work is that the hydrodynamic CIR models correctly explain why the observed DACs become narrower as they evolve over time in the line profile. The DACs narrow due to the decrease of the local wind velocity dispersion farther above the stellar surface, hence toward larger wind velocities (see Fig. 2). The DACs fade away around the terminal wind velocity because the line opacity inside the CIR model decreases radially.
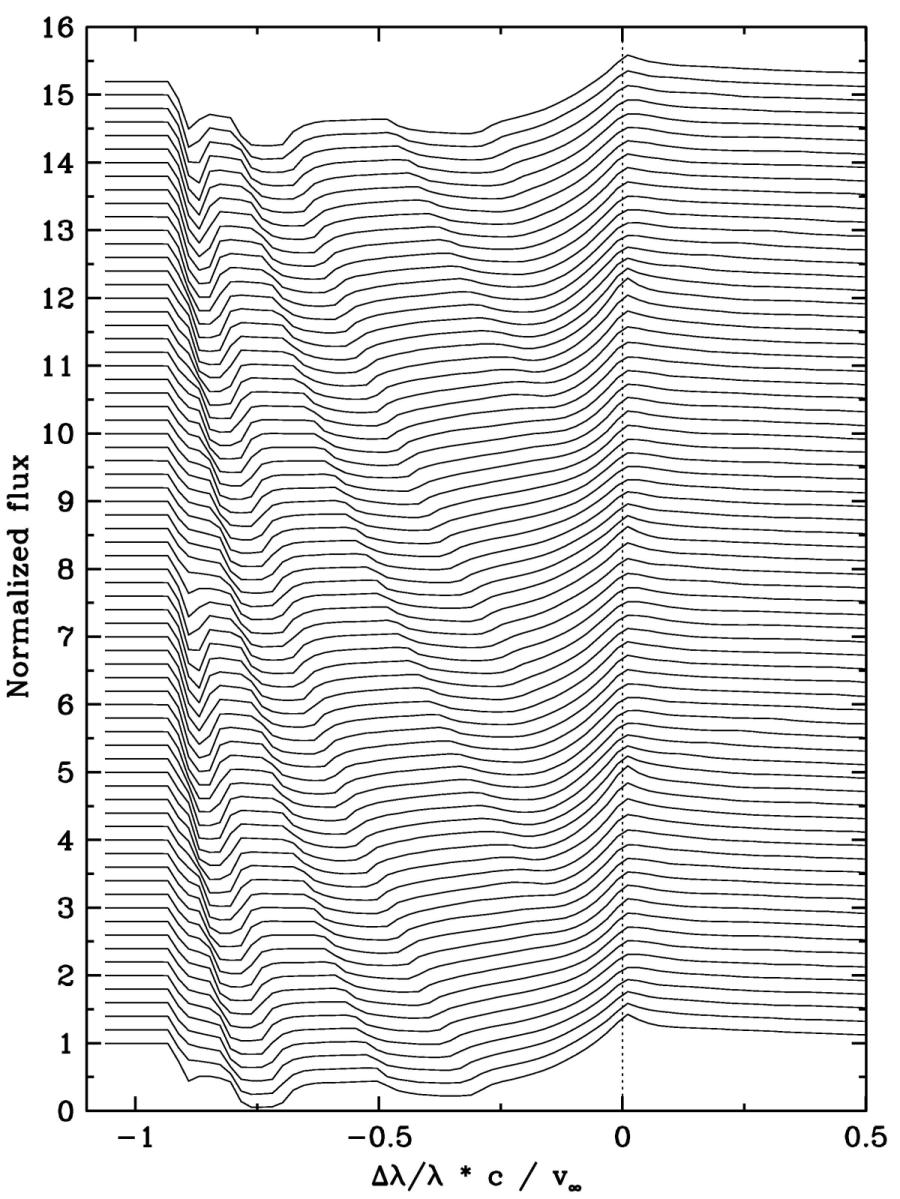
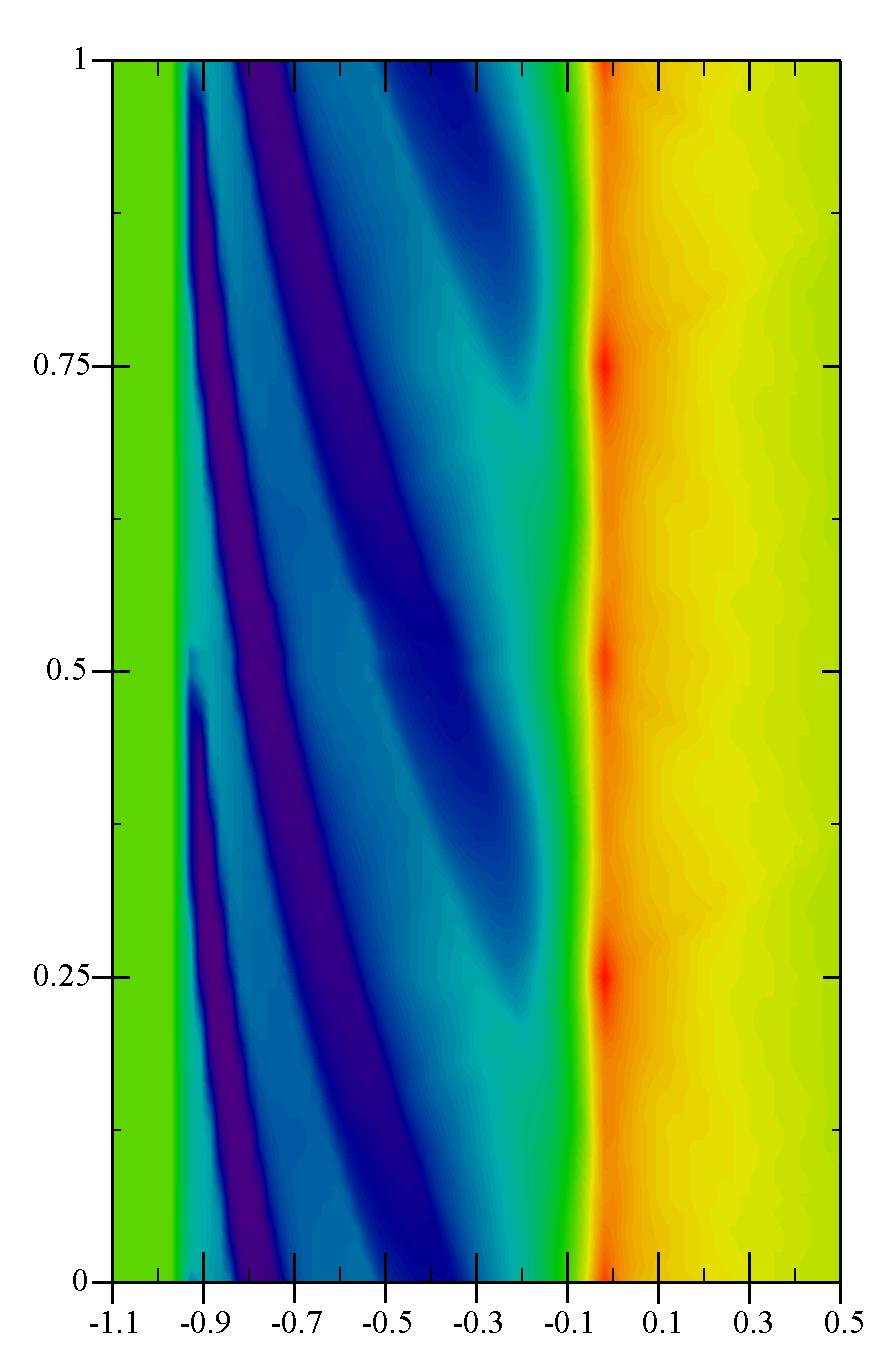
Figure 2: Left-hand panel: Spectral time sequence computed with Wind3D in the expanding wind of a hot star with two equatorial CIRs shown in
Fig. 1. The theoretical line profiles show two DACs drifting bluewards in the unsaturated absorption trough of the P Cygni profile (time runs upwards over one rotation period). Each spectrum is arbitrarily offset by +0.2 in flux compared to the preceding one.
Right-hand panel: The same time sequence of line fluxes shown with in color scale for phases 0 to 1 in the rotational cycle.
The width of the DACs decreases while shifting bluewards. They narrow because the dispersion of wind velocities projected in the observer's line of sight in front of the stellar disk decreases at larger distances from the surface, while the wind velocity increases to the terminal wind velocity.
Read more: Co-rotating Interaction Regions in Winds of Massive Hot Stars
Selected Papers
- Lobel, A., 2008, Modeling DACs in UV Lines of Massive Hot Stars, in "Clumping in Hot Star Winds", ed. W.-R. Hamann, A. Feldmeier & L. Oskinova, (Potsdam: Univ.-Verlag), URN: http://nbn-resolving.de/urn:nbn:de:kobv:517-opus-13981, p. 81. PDF astro-ph
- Lobel A., & Blomme, R., 2006, Three Dimensional Radiative Transfer in Winds of Massive Stars: Wind3D, in "The Ultraviolet Universe: Stars from Birth to Death", 26th meeting of the International Astronomical Union, Joint Discussion 4, 16-17 August 2006, Prague, ed. A. Gomez de Castro and M. Barstow (Madrid: Editorial Complutense Univ. of Madrid) pp 167-172. PDF astro-ph