The SpectroWeb Database
Research
The SpectroWeb database is an online repository of identified spectral lines and features observed in spectral standard reference stars. It is permanently updated and improved, currently providing high-resolution spectra of six bright (cool) stars selected as primary spectroscopic reference objects: Betelgeuse (Alpha Ori; M2 Iab), Arcturus (Alpha Boo; K1 III), The Sun (G2 V), Beta Aqr (G0 Ib), Procyon (Alpha CMi A; F5 IV-V), and Canopus (Alpha Car; F0 II). Their effective temperatures differ by about 1000 K, ranging from 3500 K (M-type) to 7500 K (F-type). These stars offer a broad range of thermal conditions for the identification of mainly neutral and singly ionized spectral lines formed in their atmospheres. SpectroWeb offers a comprehensive interactive database of identified spectral lines that relies on detailed comparisons of observed spectra with advanced spectrum synthesis calculations. With its graphics display users can zoom in on the same wavelength regions of interest in different stars to investigate changes of line intensities, and to directly assess the reliability of the line identifications and the quality of the corresponding atomic line data. SpectroWeb is freely accessible online at http://spectra.freeshell.org. The database's graphics interface requires a modern internet browser with an activated Java language interpreter. The object-oriented (Java `applet') implementation, for example, permits to securely link many digital spectral atlases in a single database that is served from various world-wide-web domains using a standard interactive display.
Results
SpectroWeb is an online research tool to directly assess the quality of spectral line identifications by comparing high-quality observed stellar spectra with state-of-the-art computed spectra. The web interface enables users to select 10 or 25 Angstroms wide spectral regions-of-interest from an interactive list of observed wavelengths listed to the left of the spectrum displayed in Fig. 1. The continuum normalized observed spectra (black drawn line) and computed spectra (red drawn line) are overplotted and marked with numbered spectral line identifications (arrows) in case the central line flux differs by more than two percent from the flux level of the stellar continuum. Users can zoom in on the displayed spectral regions by selecting smaller regions of interest using the left mouse button. Atomic, molecular, and Earth spectral line identifications in the region of interest can be selected from the top menu and are listed in an interactive table to the right of the spectrum. Each identified spectral line can then be selected from the tables to list corresponding detailed atomic and molecular line transition and line property information (including literature reference data for the identified line transitions) below the visualized spectrum.
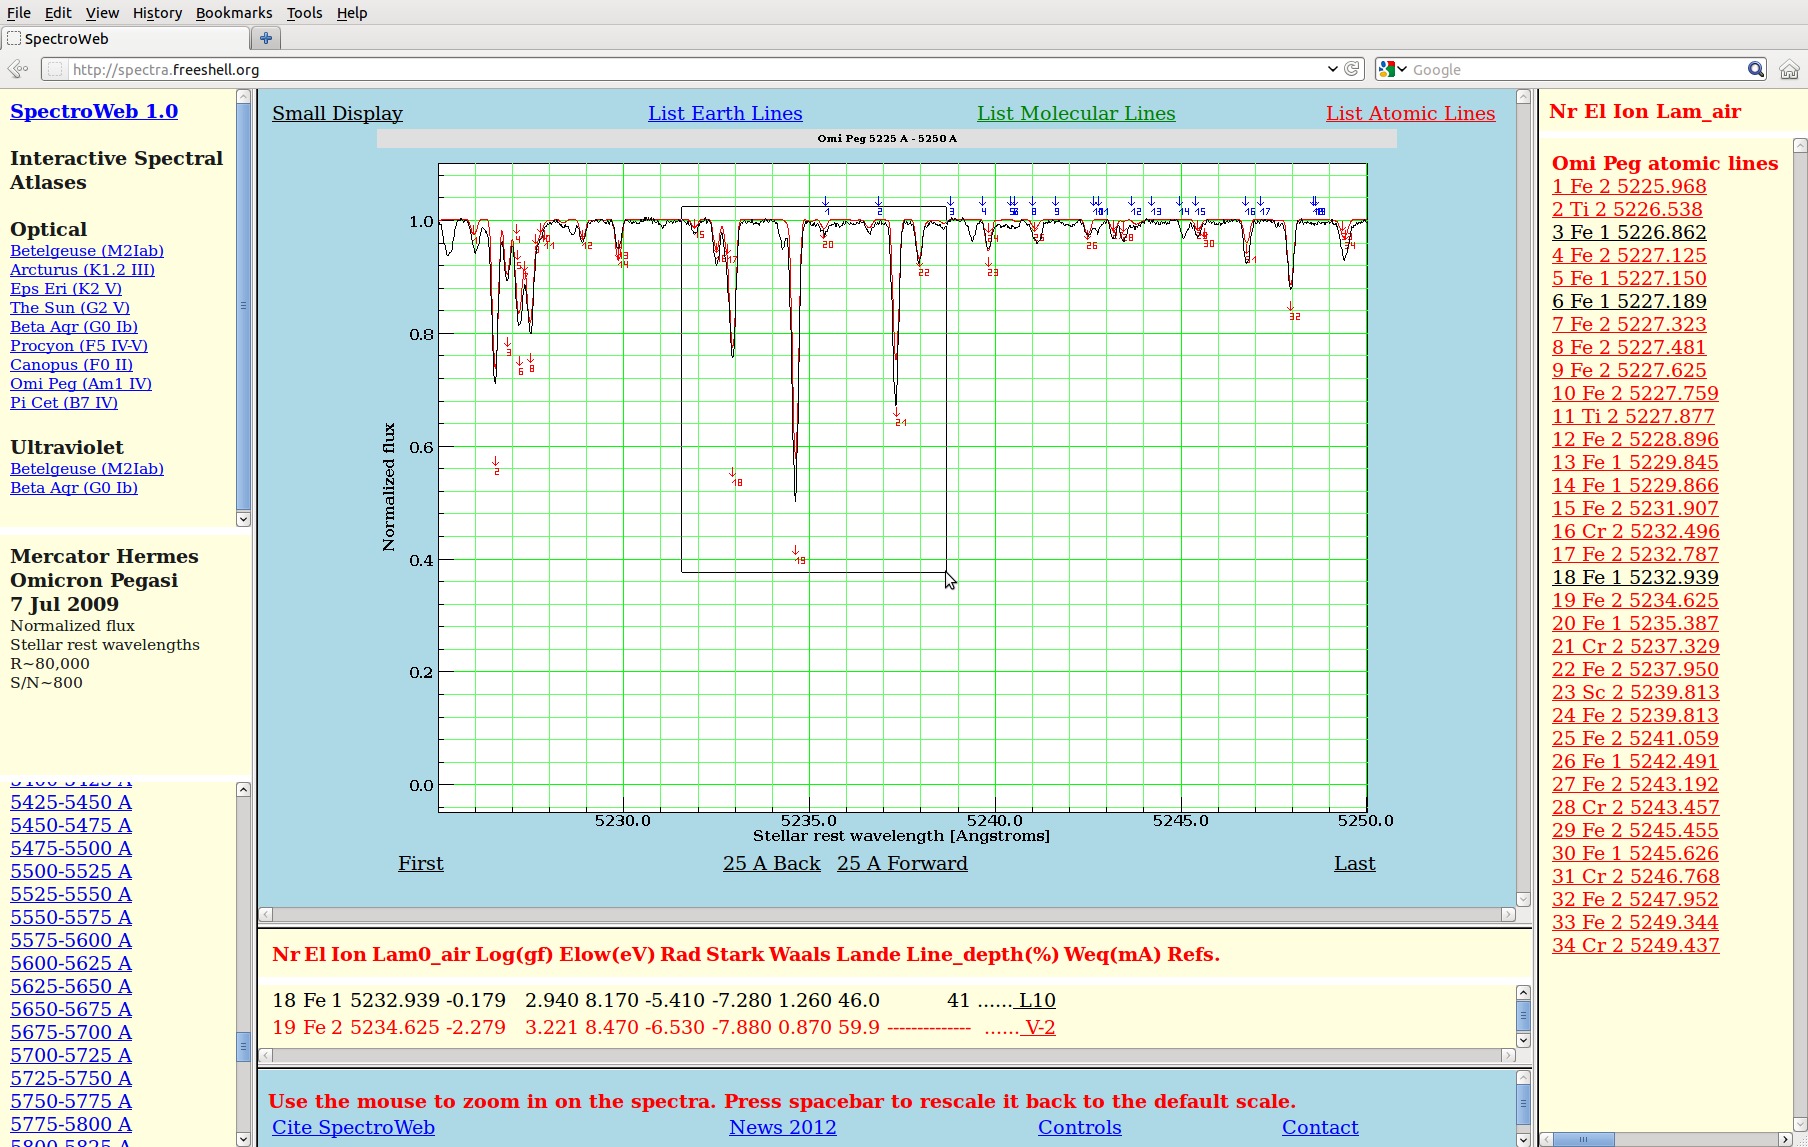
Figure 1: The SpectroWeb interface shown for the continuum normalized spectrum of the Sun over ~25 Angstroms around 6137 Angstroms.
The numbered arrows in the spectrum correspond to identified atomic lines (red labels). In other parts of the spectrum green labels mark
molecular absorption lines and blue labels mark telluric absorption lines. The atomic lines are listed to the right of the spectrum.
The table color is related to the color of the numbered line markers and alters when List Atomic Lines
(red color), List Molecular Lines (green color), and List Earth lines (blue color) identifications are selected from the top menu. Users can
switch between various target stars in the blue left-hand table and select the same region-of-interest from a list of provided wavelengths
for detailed comparisons of line strengths, widths, or line overlap. Fast paging through the spectral regions is possible with the Back and Forward
buttons in the menu below the spectrum. A Large Display or Small Display can be selected depending on the user's screen resolution. For the
atomic lines SpectroWeb currently lists the oscillator strength (log gf), the energy of the lower transition level (Elow), the four line damping
constants (Rad., Stark, Waals, Lande), the computed normalized line depth without instrumental broadening (Line depth), together with
basic literature reference information.
Link To: SpectroWeb: The Interactive Database of Spectral Standard Star Atlases
Read more: Atomic Data for Spectral Standard Stars
Selected Papers
-
Lobel, A., 2011, Oscillator Strength Measurements of Atomic Absorption Lines from Stellar Spectra,
Can. J. Phys., 89, 395 ADS
- Lobel, A., 2008, SpectroWeb: Oscillator Strength Measurements of Atomic Absorption Lines in the Sun and Procyon, 9th Int. Coll. on Atomic Spectra and Oscillator Strengths for Astrophysical and Laboratory Plasmas at Lund, Sweden, August 7-10, 2007. Journal of Physics: Conference Series, Volume 130, Issue 1, pp. 012015. PDF ADS
- Lobel, A., 2007, SpectroWeb: An Interactive Graphical Database of Digital Stellar Spectral Atlases, in "The Ultraviolet Universe: Stars from Birth to Death", 26th meeting of the IAU, Editorial Complutense Univ. of Madrid, ed. A. Gomez de Castro and M. Barstow, 167, Aug 2006, Prague, Czech Republic. PDF ADS